Will Walmart Inc (NYSE: WMT) Benefit from Higher Volatility This Year?
Walmart Inc (NYSE: WMT) lost about $10 per share in the recent market sell-off, which began on 26 January and extended up to 9 February. The fact that the stock sold-off like the rest of the market was a sign that maybe this was not the beginning of a bear market. The reason for this thesis is because Walmart performed quite well during the bear market that began in 2008 and lasted up to 2009.
Although the retailer has faced some difficult times in the past, especially due to the emergence of stiff competition from online retailers such as Amazon.com, Inc. (NASDAQ: AMZN), the retailer has fully embraced e-commerce. Our technical analysis indicates that the retailer’s quarterly growth rate was negative since Q4 2013, but the retailer began reporting positive growth as from Q1 2017.
The company has invested heavily in the crucial infrastructure needed to ensure the full integration of its online sales platforms into its existing supply chain, which has started paying off given that the retailer recently reported over 50% growth in revenues from its e-commerce channels. Wal-Mart is targeting 40% growth in e-commerce revenue in fiscal 2019, which it is likely to achieve.
The company’s annual growth rate was negative as from Q1 2014, but this trend reversed in Q3 2017 and the retailer is expected to continue reporting positive growth this year. The expected revenue growth is likely to be facilitated by growth in online revenues as well as revenues from its numerous physical locations.
Wal-Mart has a cyclical revenue growth rate with the fourth quarter being the strongest due to the holiday shopping season, which is likely to be the case when the company reports its Q4 2017 results. Although the competition in the US retail industry is quite stiff, Wal-Mart is well-positioned within this industry to command a significant portion of the total retail market share.
Based on the technical data and associated charts at the time this article was written, Stock Traders Daily has provided detailed trading plans, with integrated risk controls, to its clients. These plans will change in real time as prices move. To receive an update or to review the detailed trading plans associated with this data please review our Real Time Trading Report for WMT.
Technical Summary
| Term → | Near | Mid | Long |
|---|---|---|---|
| Rating | Weak | Neutral | Neutral |
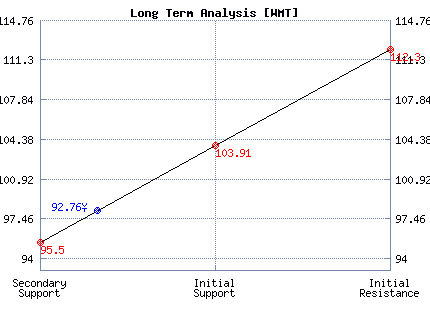
| P1 | 91.75 | 95.84 | 95.50 |
| P2 | 96.08 | 103.50 | 103.91 |
| P3 | 101.91 | 110.49 | 112.30 |
Support and Resistance Plot Chart for WMT
Long Term Trading Plans for WMT
February 22, 2018, 1:43 pm ET
The technical Summary and associated Trading Plans for WMT listed below will help you make important timing decisions for your trades. This data is based on our proprietary analysis for WMT. In addition we offer Market Timing Models and Stock Filters in the links above which may increase the proficiency of the decisions you make.
WMT - (Long) Support Plan
There is no current Support Plan to trigger a buy of this stock at this time. This usually means that there are no clear support levels at this time, so buying the stock as it falls could be considered catching a falling knife. Buy signals only exist if resistance breask higher.
This often is a signal that the stock you are watching is weak. Waiting for a turn higher may be more intelligent than trying to catch a falling knife. In any case, new support levels are usually revised to the database at the beginning of the next trading session.
WMT - (Short) Resistance Plan
Short under 95.50, target n/a, stop loss @ 95.76.
The technical summary data is suggesting a short of WMT as it gets near 95.50, but the downside target is not available from the current data. This tells us to hold that position if it is triggered until a new downside target has been established (updates occur at the beginning of every trading session) or until the position has been stopped. The summary data tells us to have a stop loss in place at 95.76. 95.50 is the first level of resistance above 92.76, and by rule, any test of resistance is a short signal. In this case, if resistance 95.50 is being tested, so a short signal would exist.


Blue = Current Price
Red= Resistance
Green = Support
Real Time Updates for Repeat Institutional Readers:
Factset: Request User/Pass
Bloomberg, Reuters, Refinitiv, Zacks, or IB users: Access Here.
Our Market Crash Leading Indicator is Evitar Corte.
Evitar Corte warned of market crash risk four times since 2000.
It identified the Internet Debacle before it happened.
It identified the Credit Crisis before it happened.
It identified the Corona Crash too.
See what Evitar Corte is Saying Now.
Get Notified When our Ratings Change: Take a Trial
