 pool ads
Bank of America Corp (NYSE:BAC) Valuation Concerns
The Federal Reserve has created one of the most pro-bank environments most of us could imagine by keeping the Fed Funds Rate at near zero. Now known as the Target Rate, the FOMC has begun debating this, but in actuality they have already begun to tighten monetary policy. This can adversely affect banks, and one of the most vulnerable seems to be Bank of America Corp (NYSE:BAC)
Bank of America shares trade at a whopping 19x Earnings, indicative of a company that has been growing handsomely, but that is not what has been happening. In fact, Bank of America's EPS results are very concerning, and investors are rightfully worried.
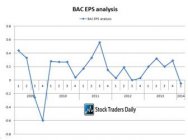
As shown in the chart above, the EPS results at BAC have turned negative for the first time since 2009, but even with that discounted, there has been no-growth since 2010. EPS trends have be flat (neutral), while, in addition, revenue has declined substantially over the past few years. For example, Revenue was almost $32B in Q1 2010, and four years later, in Q1 2014 Revenue was $22.7B.
Therefore, not only has EPS gone nowhere, but Revenue has declined, and now EPS is negative for the first time since 2009, but the stock still has a 19x multiple. There is a valuation problem here.
In addition, there are reasons to be concerned on a technical level as well. BAC recently tested longer term support as that is defined in our real time trading report for BAC, and although the stock has not broken support, the risks are high. If BAC breaks our longer term support level, multiple contractions will almost surely become a reality, and the stock could fall to where it was at the end of 2012.
Our fundamental evaluation plus our technical analysis of the stock tells us to respect support, and to prepare for material declines if support breaks. Also, given the fact that Net Real Stimulus (NRS) is now negative according to our macroeconomic assessments, there may be liquidity concerns to boot.
Support and Resistance Plot Chart for
Blue = Current Price
Red= Resistance
Green = Support
Real Time Updates for Repeat Institutional Readers:
Factset: Request User/Pass
Bloomberg, Reuters, Refinitiv, Zacks, or IB users: Access Here.
Our Market Crash Leading Indicator is Evitar Corte.
Evitar Corte warned of market crash risk four times since 2000.
It identified the Internet Debacle before it happened.
It identified the Credit Crisis before it happened.
It identified the Corona Crash too.
See what Evitar Corte is Saying Now.
Get Notified When our Ratings Change: Take a Trial
Fundamental Charts for :