 pool ads
Caterpillar Inc. (NYSE:CAT) is at an Inflection Level
Shares of Caterpillar Inc. (NYSE:CAT) are at a major level of inflection according to our analysis and the ability or inability of the stock to hold this inflection level will tell you whether you should be a buyer or seller of the stock. If it breaks the stock could fall very hard given the associated fundamental risks, but if it holds the channel will suggest a progression back to longer term resistance (a positive sign).
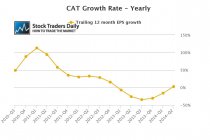
There is good news and bad news for investors in Caterpillar. The good news is that the decline in earnings growth seems to have subsided, in fact earnings growth is positive for the most recent quarter and that was the first positive yearly earnings growth for Caterpillar in five consecutive quarters.
Breaking the string of negative earnings growth is definitely a good thing, but now valuation comes into question and that is where the concerns exist. The stock is trading near 17x earnings, after onetime events are excluded from results, and given the lack of earnings growth for Caterpillar recently that is a very high multiple.
The simple question is, as an investor, should you be willing to pay 17x earnings for a company that has contracted both earnings and revenue on a yearly growth basis for 5 out of 6 recent earnings results?
Individual investors will need to make up their own minds, and the answers they come up with will be different because some people will love the company more than the stock price, but in our opinion the stock price is all that matters when it comes to making money in the stock market.
That brings our technical observations into play, and from our technical observations Caterpillar is currently flirting with a level of longer term support. In order for the stock to provide positive signals based on price the stock will need to hold longer term support. If longer term support breaks we will consider that to be an advanced indicator that smart money is not willing to hold the stock at these levels. According to our real time trading report for CAT the stock is testing longer term support right now.
Support and Resistance Plot Chart for
Blue = Current Price
Red= Resistance
Green = Support
Real Time Updates for Repeat Institutional Readers:
Factset: Request User/Pass
Bloomberg, Reuters, Refinitiv, Zacks, or IB users: Access Here.
Our Market Crash Leading Indicator is Evitar Corte.
Evitar Corte warned of market crash risk four times since 2000.
It identified the Internet Debacle before it happened.
It identified the Credit Crisis before it happened.
It identified the Corona Crash too.
See what Evitar Corte is Saying Now.
Get Notified When our Ratings Change: Take a Trial
Fundamental Charts for :