 pool ads
Cautious Still on Yum Brands, Inc. (NYSE:YUM)
Let's not confuse making money with a stock from our interest in the company, management, products, or anything else. All that matters to us as investors is a stock's price, and if we pay attention to what smart money investors are doing with their pocketbook, we can tell what we should be doing with ours.
In this article we're going to review Yum! Brands, Inc. (NYSE:YUM) using an earnings driven fundamental approach. Revenue will also play a role in this evaluation, but ultimately our conclusion will be based on price because the price of the stock is what will make us money, not the fundamental observations.
When we look at the earnings results (we exclude 1-time events from our analysis) for Yum Brands we can see that the most recent result was lower than the previous quarter, but much higher than it was the same quarter from last year. That week quarter from 2013 plays a significant role in our observations because that degree of weakness makes the current earnings results look solid, where they may not be quite as solid as they look.
Our evaluation of earnings growth is based on trailing 12 month results and for every quarter we calculate trailing 12 month results to provide us with earnings data that includes a complete cycle. In our quarterly earnings growth chart we compare this trailing 12 month earnings data to the prior quarter to see how earnings are growing on a quarterly basis. In our yearly earnings growth chart we compare the trailing 12 month data to the same period of the previous year to evaluate yearly earnings growth. In both instances, we plot that data for every quarter for the past few years and from that we are witness to a clear earnings growth chart pattern.
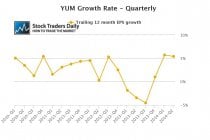
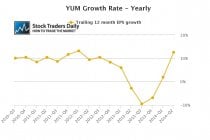
On a quarterly basis, earnings growth for Yum Brands exceeds 5%, and on a yearly basis earnings growth for Yum Brands exceeds 12%, but each one of those data compares current numbers to numbers that included a very bad result in the same quarter of last year.
Our general observation suggests that earnings growth has been realized over the years, but current earnings are only modestly higher than where they were in 2010. The stock price, however, has doubled during that same timeframe, but it has not been due solely to earnings growth.
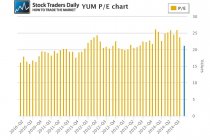
Instead, shares of Yum Brands have increased primarily due to multiple expansion. Back in 2010 shares of Yum Brands traded with a PE multiple closer to 15, while recently the stock traded with a PE multiple much closer to 25 times earnings. The current PE multiple, over 20, seems rich, but not too far out of line if the company is actually growing earnings at 12% a year. The problem is, Yum Brands has not been growing earnings at that rate historically, and had it not been for the awful result in the second quarter of 2013 the comps would not look nearly as good.
We cannot be sure if this observation is playing a role in the decisions of smart money or not, but we can tell exactly what they are doing with their pocketbooks, and it is what they do with their money that really matters to us on a technical basis. Smart money has recently been selling, and they have driven the stock down to longer term support levels, and Yum Brands has actually started to break below longer term support as we have defined that in our real time trading report for YUM.
As a result, it is fathomable that the current yearly growth rates that appear to exist for Yum Brands are being heavily discounted and the multiple expansion that has been taking place for years is finally coming into question. We cannot be sure if this is happening or not, but we can be sure enough about the direction of the stock to understand that it is beginning to break below longer term support and that is enough reason for us to suggest that investors avoid Yum Brands unless the stock immediately reverses back into its longer term trading channel. At the time this was written, Yum Brands was breaking longer term support slightly and that is an inflection catalyst.
For traders, unless YUM reverses back again it would also be an interesting short. Use longer term converted resistance (former support) as a risk control.
Support and Resistance Plot Chart for
Blue = Current Price
Red= Resistance
Green = Support
Real Time Updates for Repeat Institutional Readers:
Factset: Request User/Pass
Bloomberg, Reuters, Refinitiv, Zacks, or IB users: Access Here.
Our Market Crash Leading Indicator is Evitar Corte.
Evitar Corte warned of market crash risk four times since 2000.
It identified the Internet Debacle before it happened.
It identified the Credit Crisis before it happened.
It identified the Corona Crash too.
See what Evitar Corte is Saying Now.
Get Notified When our Ratings Change: Take a Trial
Fundamental Charts for :