 pool ads
Don't Buy Bank of America Corp (NYSE:BAC) Here
The pullback in the stock market at the beginning of this year has many investors concerned, and rightfully so, and that means we need to exercise caution and maintain our risk controls. Even in situations where opportunities look exceptional and when analyst expectations for the coming year are extremely high, precautions must be taken.
When I look at the fundamentals of Bank of America Corp (NYSE:BAC) it certainly seems odd that the stock is so strong. There is one rationale for that, and I will discuss it here, but aside from that one item the fundamental progression at Bank of America is not positive at all, but still the stock price has increased.
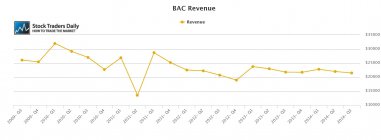
Anyone who bought the stock back at the end of 2011 is thrilled to see Bank of America trade at $17.00 per share, but during that time revenue has not grown at all and earnings have not grown at all. The only growth seen at Bank of America is in its price earnings multiple, and arguably multiple expansion, not earnings growth, has been the catalyst for the stock.
In the charts below I offer this in graphical format. The trajectory of the stock price is quite clear, as are the second two charts. Both earnings and revenue have gone nowhere since 2011, as we can see, but it is the chart of the PE multiple that actually provides evidence of the rationale I have identified above. The PE multiple at Bank of America is 41 times earnings.
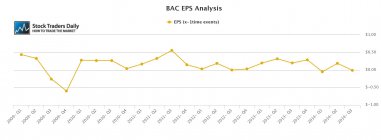
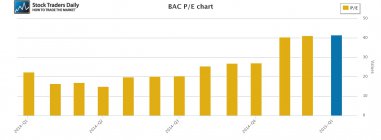
Such a high PE multiple could be warranted if corresponding earnings growth was solid, but corresponding earnings growth at Bank of America has been nonexistent, so our attention must turn to forward looking observations as those are provided by consensus analyst estimates.
In fact, it is these forward looking estimates that provide the rationale for the increase in share price and the multiple expansion of late. Analysts are expecting earnings growth next year in excess of 200%.
Technical take:
According to our technical observations for Bank of America (BAC trading report) the stock recently came very close to a test of longer-term resistance and it has since begun to pull back. If the stock continues to pullback from these tests of longer-term resistance we would expect a test of longer term support, but the channel is an upward sloping channel, positive by nature, and therefore it would require a break of support to disrupt the stocks progression higher over time. Otherwise, the technical observations we are witness to are simply natural transitions from resistance to support within an upward sloping channel thus far.
Summary:
When analyst estimates are as lofty as they seem to be for Bank of America, it raises eyebrows, and there is nothing in either the earnings were revenue charts that suggest that a progression like that will take place, so we must exercise a degree of caution given the lofty PE multiple, but the lack of positive fundamental attributes as those pertain to earnings and revenue growth are not the guiding hand that we follow when it comes to making money in the stock market.
Instead, we respect price and therefore our focus is on the longer term trading channel for Bank of America. Bank of America has already tested resistance, and it is in a process of declining towards support, so we would not be buyers here, but if support is tested, which it could be soon, we would consider a buy with a stop loss in place its support broke.
Disclaimer:
Stock Traders Daily provides trading strategies, which by definition incorporate risk controls, and it has only engaged in buy and hold strategies twice since the turn of the century. The first was in October of 2002, and those buy and hold strategies lasted until 2006, and the second was in February of 2009, and those buy and hold strategies lasted until the end of 2010. Every point in between Stock Traders Daily has been providing risk controlled strategies, market based strategies, and strategies for approximately 3000 individual stocks, which are unbiased and which incorporate the notion that short term gains lead to long term success. There is a time and a place for buy and hold strategies and this is neither the time nor the place for that approach in our opinion. Risk controls are essential.
Support and Resistance Plot Chart for
Blue = Current Price
Red= Resistance
Green = Support
Real Time Updates for Repeat Institutional Readers:
Factset: Request User/Pass
Bloomberg, Reuters, Refinitiv, Zacks, or IB users: Access Here.
Our Market Crash Leading Indicator is Evitar Corte.
Evitar Corte warned of market crash risk four times since 2000.
It identified the Internet Debacle before it happened.
It identified the Credit Crisis before it happened.
It identified the Corona Crash too.
See what Evitar Corte is Saying Now.
Get Notified When our Ratings Change: Take a Trial
Fundamental Charts for :