 pool ads
Facebook Inc (NASDAQ:FB) is Not Like Other High Fliers
The Market presents serious risks as far as we are concerned, but no one can be sure what will happen. What we are sure of is when the market falls hard high flying stocks often fall hardest, but not all high fliers are created equal.
Some have dramatically skewed valuation metrics, while others have a very quantifiable rationale for current stock prices. Facebook Inc (NASDAQ:FB) is not only a company that many would consider to be a highflier, but it is also a company that has quantifiable metrics.
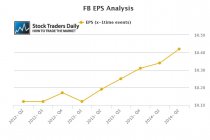
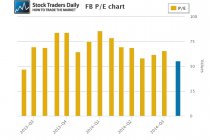
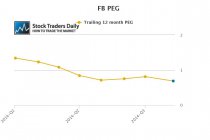
Although Facebook trades with a PE multiple of 55x earnings given EPS results that exclude onetime events, earnings have been growing faster than that, and the peg ratio for Facebook is 0.69. Using a peg ratio analysis, Facebook appears to be almost a value play given its growth rate.
However, rational minds must prevail and the reason Facebook does not have a multiple much higher than it currently has is that eventually growth will come down from its current rate, at least that's the widely held perception. This is very typical of a company that has quantifiable valuation metrics.
Given the charts below these observations become quite clear.
Now, from a technical standpoint, Facebook appears to be in the process of increasing towards longer term resistance as that is defined in our real time trading report for FB. The stock has not tested longer-term resistance yet, and if the market stabilizes we would then expect Facebook to proceed to test longer term resistance.
The catch is that the market must stabilize for the stock to increase solidly because Facebook, like other highflying stocks, will eventually get hit if the market begins to pull back aggressively. Therefore, we must maintain a clear focus on the market because the market's ability or inability to remain stable after experiencing this modest decline will likely govern the direction of Facebook in the months ahead. If the market at least stabilize is Facebook is likely to test longer term resistance as we have defined it.
That's where the risk comes in, because according to our macroeconomic analysis, The Investment Rate, the economy and stock market are already in the process of beginning a contraction, so although Facebook looks interesting both on a valuation and technical basis, our main concern rests in the health of the market itself, and yes, just as a rising tide lifts all boats the opposite happens when markets contract. Proceed with caution, but FB does look interesting.
Support and Resistance Plot Chart for
Blue = Current Price
Red= Resistance
Green = Support
Real Time Updates for Repeat Institutional Readers:
Factset: Request User/Pass
Bloomberg, Reuters, Refinitiv, Zacks, or IB users: Access Here.
Our Market Crash Leading Indicator is Evitar Corte.
Evitar Corte warned of market crash risk four times since 2000.
It identified the Internet Debacle before it happened.
It identified the Credit Crisis before it happened.
It identified the Corona Crash too.
See what Evitar Corte is Saying Now.
Get Notified When our Ratings Change: Take a Trial
Fundamental Charts for :