 pool ads
Facebook Inc (NASDAQ:FB) is Not a Buy Here
In today's world investors do not seem to be in search of value at all, in fact many investors shun the notion completely and that in itself is risky, but identifying value is not as simple as merely looking at a PE multiple. More needs to be done, and none of us should be blind to valuation risks.
Facebook Inc (NASDAQ:FB) is a company investors love to hate because of what happened after the IPO, many investors questioned the valuation as well, but for those who are just looking at the numbers Facebook actually trades at a fair value given its growth rate. If the company hiccups at all that sanguine picture can change, but for now at least Facebook looks solid from a fundamental standpoint.
Although the company looks solid on a fundamental basis that does not mean that the technicals support buying the stock at these levels. We will discuss technicals later in the article, and focus on the fundamentals first, but do not misconstrue a solid fundamental observation with a buy signal.
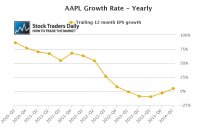
We do not have much data to work with because Facebook is relatively new, but the growth rate has been superb and although the PE multiple is extremely high, the trailing 12 month PEG ratio, a measure we use to identify where stocks show value over time, is less than 1, and that's great. Some might argue that Facebook might even be a relative value play because of that, but we will not go that far.
On a technical basis, and according to our real time trading report for FB, buy signal surfaced when the stock traded near $57.00. According to our report, that is where longer term support was, and now the stock appears to be in the process of increasing towards longer-term resistance again.
For people interested in buying Facebook, our technicals tell them to wait, but for people interested in selling it you should look to do so when the stock tests longer-term resistance again. Given the volatility in this stock it is also likely to be in excellent short from resistance to support, but short Sellers should not be blind to the fundamental observations made above. The stock moves nicely, we can trade it nicely, but unless something changes it actually looks fairly valued at this time so respect the technicals.
Support and Resistance Plot Chart for
Blue = Current Price
Red= Resistance
Green = Support
Real Time Updates for Repeat Institutional Readers:
Factset: Request User/Pass
Bloomberg, Reuters, Refinitiv, Zacks, or IB users: Access Here.
Our Market Crash Leading Indicator is Evitar Corte.
Evitar Corte warned of market crash risk four times since 2000.
It identified the Internet Debacle before it happened.
It identified the Credit Crisis before it happened.
It identified the Corona Crash too.
See what Evitar Corte is Saying Now.
Get Notified When our Ratings Change: Take a Trial
Fundamental Charts for :