 pool ads
Gilead Sciences, Inc. (NASDAQ:GILD) Selected as the Stock of the Week
To put it mildly, Gilead Sciences, Inc. (NASDAQ:GILD) blew away estimates the last time it reported earnings, but the stock tanked between March and April. The decline of about 30% certainly surprised some investors, and to their chagrin, at least some of that can be attributed to Government intervention in the free capital markets yet again, but this article is not about that.
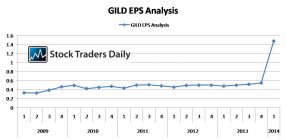
Instead, simple math tells us that 12 months from now the otherwise rich-looking valuation for Gilead could be much more attractive. Doing simple math, without assuming any growth from the most recent quarter, which I know will be argued by some, Gilead would be earning about $5.92 per share annually given the most recent EPS result. No one can be sure if the company will be able to match that, but expectations are high, and if they are able to match or exceed estimates the P/E multiple, which is now about 30x, will drop to about 13x within 9 months. That will make this currently rich-looking stock fairly valued.
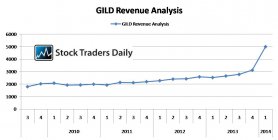
The graphs below demonstrates the eye-popping changes that have happened recently, and by most definitions this is exactly what investors look for, but we think investors should moderate expectations.


Unfortunately for investors who want to see a one-sided increase, 9 months is a very long time, and there will surely be additional undulations along the way given the imposition of the Government, so instead of investing in Gilead at this time we are recommending trading strategies instead. In fact, Gilead has been selected as our Stock of the Week this week, and according to our observations the stock does have upside potential until resistance levels are tested again.
Our real time trading report for GILD suggests that the stock recently fell to test longer term support, it held and it has reversed higher and recently also broke above an intra channel resistance level, and that opens the door for a continued progression to longer term resistance.
When stocks carry with them high expectations and lofty multiples they also often have significant volatility, and although investors have been rewarded and could still be rewarded if the company beats forward estimates too, the best opportunities may actually be found in trading the stock instead.
Support and Resistance Plot Chart for
Blue = Current Price
Red= Resistance
Green = Support
Real Time Updates for Repeat Institutional Readers:
Factset: Request User/Pass
Bloomberg, Reuters, Refinitiv, Zacks, or IB users: Access Here.
Our Market Crash Leading Indicator is Evitar Corte.
Evitar Corte warned of market crash risk four times since 2000.
It identified the Internet Debacle before it happened.
It identified the Credit Crisis before it happened.
It identified the Corona Crash too.
See what Evitar Corte is Saying Now.
Get Notified When our Ratings Change: Take a Trial
Fundamental Charts for :