 pool ads
EPS Growth rates may be changing at SanDisk Corporation (NASDAQ:SNDK)
Pay very close attention to the transition in EPS growth trends for SanDisk. In the first quarter of 2013 growth recovered from a trough and began to accelerate, but most recently the growth trend may have actually peaked. The company is still growing, but the rate of growth is changing, and when the rate of growth has changed in the past the stock followed.
Growth rates at SanDisk Corporation (NASDAQ:SNDK) have been exceptional and if the company matches earnings expectations when it reports on Wednesday it will continue that growth cycle. Analysts expect the company to report $1.39 in earnings per share.
According to our observations the company has been growing quite rapidly. Our yearly earnings growth chart below demonstrates that growth trend. In this chart we compare trailing 12 month data on an annual basis to determine yearly growth rates. For example, we calculate the trailing 12 month data from this quarter and compare it to the trailing 12 month data from the same quarter of the previous year to determine yearly growth rates for earnings.
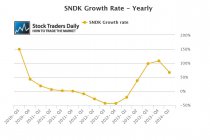
For SanDisk, the company saw a trough in earnings growth trends in the first quarter of 2013, and since then earnings have been growing rapidly. Almost like clockwork, the stock also responded nicely to the change in earnings growth trends. The stock has accelerated as earnings growth accelerated and at current levels SanDisk trades at 22 times earnings.
Interestingly, although this is higher than the multiple for the market itself, SanDisk has been growing much faster than the market and higher PE multiples are therefore warranted. The only concern comes from that observation of growth back in 2013. The stock responded quite nicely to the shift in growth trends from the trough, but according to our earnings growth chart a reversal from a recent peak in earnings growth may also be taking place. If that is true and the stock responds to slower earnings growth like it did to accelerated earnings growth back in 2013 it could be a precursor.
For traders, our real time trading report for SNDK suggests that the company is poised to test its longer term resistance level, so there is additional upside according to our report, but only modest upside potential until resistance is tested. In fact, if resistance is tested we would then expect the stock to turn lower and fall all the way to the longer term support level identified in our report.
Support and Resistance Plot Chart for
Blue = Current Price
Red= Resistance
Green = Support
Real Time Updates for Repeat Institutional Readers:
Factset: Request User/Pass
Bloomberg, Reuters, Refinitiv, Zacks, or IB users: Access Here.
Our Market Crash Leading Indicator is Evitar Corte.
Evitar Corte warned of market crash risk four times since 2000.
It identified the Internet Debacle before it happened.
It identified the Credit Crisis before it happened.
It identified the Corona Crash too.
See what Evitar Corte is Saying Now.
Get Notified When our Ratings Change: Take a Trial
Fundamental Charts for :