Margin Debt is Crushing the Market
Late in 2015 Stock Traders Daily issued a special report to its clients discussing the risks associated with margin debt as that related directly to the level of the stock market.
At that time our identification showed a material discrepancy between the demand for stocks that existed and the natural demand ratios that should have existed according to our macroeconomic observations. The conclusion was, after a careful review of margin debt, that it was the assumption of this margin debt that was keeping the market afloat during a time when it otherwise would have deteriorated.
However, our identification of increasing margin debt ratios was not alone satisfactory to make this observation. The infusions of capital by the FOMC during their stimulus program added dollars to the coffers of institutional investors which naturally, at least most probably, translate into higher margin debt levels over time. It was no surprise that margin debt levels were at all time highs, but there was a surprise in the numbers and that surprise was meaningful.
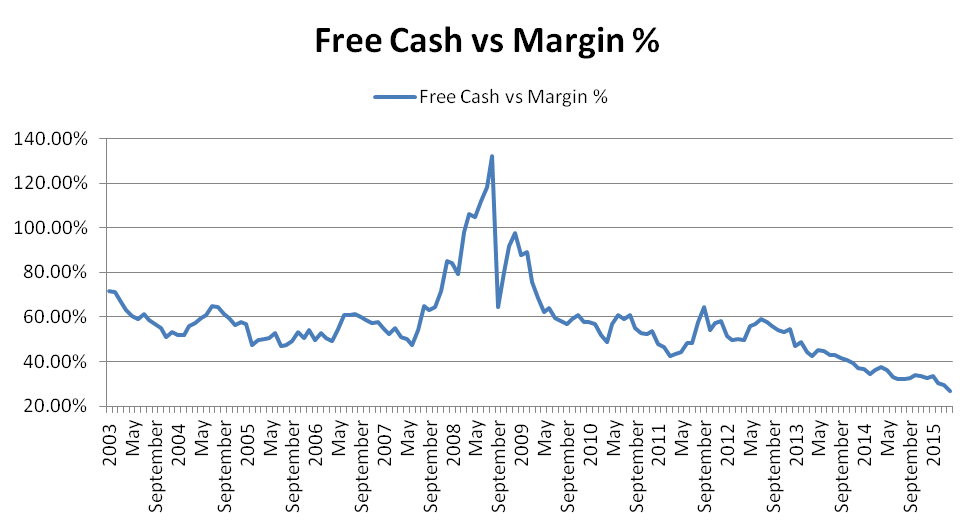
The surprise came from the comparison of free cash to margin debt.
Specifically, as the chart below shows, the ratio of free cash to margin debt on the New York Stock Exchange reached an all time low late in calendar 2015. That suggested an inability to continue to add margin debt and therefore an inability to continue to support asset prices with leverage.

However, this also says something else, and it is this that is most important to today's market.
The added margin debt levels as those were related to free cash certainly painted red flags at the end of 2015, suggesting that institutional investors were exhausted, but something else happens when markets begin to decline and that is institutional investors often reduce their margin debt exposure.
The media likes to talk about margin calls, but margin calls typically only apply to smaller investors because institutional investors manage their debt properly. That doesn't mean they won't need to sell, it simply means that they are unlikely to get a margin call because they will have sold before a margin call hits. In many ways, this seems to be happening in front of our eyes.
With margin debt levels at all time highs and free cash to margin debt at all time lows it was clear that institutional investors did not have the ability to continue to support the market, and it is now equally as clear what the impact of the reduction in margin debt exposure is having on equity prices.
Instead of supporting asset prices the influence of institutional investors in today's market as they remove margin debt from their books is to drive down asset prices instead.
From here the natural growth rates as those are defined by our macro economic analysis, the Investment Rate, and the RE version back to natural demand ratios come into play.
Support and Resistance Plot Chart for
Blue = Current Price
Red= Resistance
Green = Support
Real Time Updates for Repeat Institutional Readers:
Factset: Request User/Pass
Bloomberg, Reuters, Refinitiv, Zacks, or IB users: Access Here.
Our Market Crash Leading Indicator is Evitar Corte.
Evitar Corte warned of market crash risk four times since 2000.
It identified the Internet Debacle before it happened.
It identified the Credit Crisis before it happened.
It identified the Corona Crash too.
See what Evitar Corte is Saying Now.
Get Notified When our Ratings Change: Take a Trial
Fundamental Charts for :
