 pool ads
Priceline (NASDAQ:PCLN) Testing Longer Term Support
Priceline (NASDAQ:PCLN) has recently tested longer term support as that is defined in our real time report for PCLN and that makes PCLN a technical buy even though it faces additional risks. That buy signal is conditional, based on PCLN holding support, but thus far support is holding.
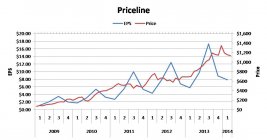
Countering the technical buy signal are two fundamental risks. Larger skews to EPS growth than in previous years are clear. The results from PCLN are seasonally driven, and the first quarter always has shown a significantly lower EPS result than the fourth quarter; this is obvious from the comparison chart below.
The difference this year is two-fold.
First, the magnitude of the skew between price and EPS is greater this year, even after the pullback that has already occurred. Obviously EPS growth expectations are high, and from a pure P/E perspective, recent growth suggests that PCLN may be fairly valued or even slightly undervalued, but additional material risks exist that are even more important than the EPS skew.
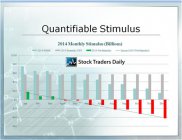
Specifically, PCLN is a high beta stock that depends on excess liquidity. When excess liquidity levels dry up, so does some of the demand for stocks like PCLN, and effectively, excess liquidity has not only dried up, but Net Real Stimulus (NRS) is effectively negative and set to turn more negative if FOMC tapering continues. This will spell trouble from the demand side (fewer dollars chasing the stock).
NRS timetable:
Therefore, investors in PCLN should be careful. There is a skew when comparing EPS to Price historically and there are fewer dollars available in the financial system to chase high beta names. These can cause problems, but the stock is not yet broken technically.
Our trading-based observations for PCLN tell us that the stock has actually recently tested longer term support, and if longer term support holds it can move higher. According to our real time trading report for PCLN, the stock moved down from longer term resistance to longer term support already, and it is when stocks test longer term support that buy signals surface for traders. If PCLN holds longer term support we would expect longer term resistance to be tested again by rule, but if support breaks traders should get out because there is significant room to fall if support breaks. Support therefore is not only a buy signal but also acts as a measure of risk control.
Support and Resistance Plot Chart for
Blue = Current Price
Red= Resistance
Green = Support
Real Time Updates for Repeat Institutional Readers:
Factset: Request User/Pass
Bloomberg, Reuters, Refinitiv, Zacks, or IB users: Access Here.
Our Market Crash Leading Indicator is Evitar Corte.
Evitar Corte warned of market crash risk four times since 2000.
It identified the Internet Debacle before it happened.
It identified the Credit Crisis before it happened.
It identified the Corona Crash too.
See what Evitar Corte is Saying Now.
Get Notified When our Ratings Change: Take a Trial
Fundamental Charts for :