 pool ads
Smaller Investors, not Always Wrong
Recently, financial media 'gurus' who used to be focused on fundamentals have shifted to being perceived experts on technical chart patterns, but many of the tools they use do not live up to their mythological expectations.
Traders enjoy technical terminology such as “the golden cross” or the “death cross," head and shoulders, trendlines, breakouts, and the ever popular 200 day moving average, but the vast majority of these popular indicators are more mythological than real. This means that they have been untested and a rigorous test often reveals mixed results in spite of what the new technical TV gurus would have us believe.
Other popular market myths abound. They frequently they provide a false sense of comfort to traders. One of these “comforting” or perhaps “discomforting” statements is: “the small trader is always wrong”. To me such a blanket statement is no more correct than the current controversial statement that “the stock market is rigged”. We need to be careful what we tell ourselves lest we begin to believe it.
Let’s try and evaluate the statement that “the small trader is always wrong” by looking at some objective data that may lend some credence to this belief or perhaps temper our confidence in this commonly held belief. Admittedly this is not a rigorous test, but the data is available for testing.
Shown below is a chart of Standard & Poor’s 500 futures plotted against the DAILY SENTIMENT INDEX (DSI) small trader sentiment index. The DSI has been collated daily since 1987 and provides a percentage of small trader bullish or bearish sentiment daily on active US futures markets. Support for the “small trader is always wrong” statement would be confirmed if there existed a high correlation between the index being extremely low at market bottoms and extremely high at market tops.
In other words, to put numbers on it, if 85% of the sample was bullish at market tops and 15% were bullish at market bottoms then this would support the statement that small traders were usually on the wrong side of the market when tops and bottoms occurred. When I refer to 'the market' I am talking about the S&P 500 specifically, and that can be tracked using SPDR S&P 500 (NYSEARCA:SPY) In order for the “small trader is always wrong” statement to be true correlation would need to be 100% which of course it is not.
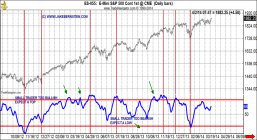
DSI Index vs. S&P EMini 500 futures daily. High readings (i.e. 80% bullish or higher) correlate closely with market tops BUT NOT ALWAYS! I have marked (arrows) three instances in which small trader sentiment was very bullish but which DID NOT signal a market top. Small trade sentiment at two significant bottoms was correct but this is also not always the case. Simply stated, there are no absolutes or Holy Grails. My study of small trader sentiment back to 1987 suggests that the small trader is “not always wrong” but rather can serve as a setup or as a leading indicator of market turning points. If the small trader was “always” wrong they wouldn’t play the game.
Stock Traders Daily was established in January of 2000, and provides macroeconomic analysis, trading strategies, and newsletter services online. Jack Bernstein is a contributor, and owner of www.jakebernstein.com
Support and Resistance Plot Chart for
Blue = Current Price
Red= Resistance
Green = Support
Real Time Updates for Repeat Institutional Readers:
Factset: Request User/Pass
Bloomberg, Reuters, Refinitiv, Zacks, or IB users: Access Here.
Our Market Crash Leading Indicator is Evitar Corte.
Evitar Corte warned of market crash risk four times since 2000.
It identified the Internet Debacle before it happened.
It identified the Credit Crisis before it happened.
It identified the Corona Crash too.
See what Evitar Corte is Saying Now.
Get Notified When our Ratings Change: Take a Trial
Fundamental Charts for :