 pool ads
Tesla Motors Inc (NASDAQ:TSLA) Is Falling From Resistance
It is starting to happen. After the excess liquidity environment analysts are finally starting to question valuations. The free flowing money has caused some stocks to run much more than they should, and in some cases that excess money was chasing the same group of stocks. Tesla Motors Inc (NASDAQ:TSLA) is absolutely part of that group.
Some analysts have come out and said that the stock has run too far too fast, but the earnings growth has been spectacular, the products are fabulous and cutting edge, and the company is planning to be a major supplier of batteries for electric vehicles. To some investors it might seem crazy that analysts are warning investors that the stock has run too far too fast, but here is some food for thought.
First, let me say something about the macroeconomic environment. The Federal Reserve has flooded the economy with liquidity and when that happens money starts to chase investments in rather frivolous ways. Yesterday, I used AutoDesk (ADSK) as an example of a company that increased due to multiple expansion while earnings growth actually declined aggressively, but for Tesla that is not the case.
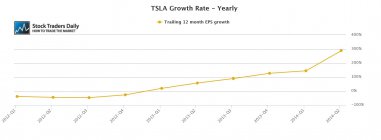
For Tesla, earnings growth has been fantastic, so the appreciation of the stock price can be supported by recent earnings growth. However, the part of the equation that is extremely important is that the comps from 2012 are still playing a significant role in year over year earnings growth models.
Specifically, when we evaluate earnings we do so using trailing 12 month data. Therefore, this quarter would include three previous quarters in our yearly growth rate analysis. In addition, you would then compare the yearly growth rate for this quarter to the yearly growth rate from the same quarter of the previous year to determine year over year earnings growth. In doing that some of the data from 2012 is included in the analysis, and those comps are very easy.
As a result, when we look at the earnings growth chart for Tesla we see eye popping numbers. After the last earnings release, earnings growth was 288%. No one thinks that is a bad number, so don't misconstrue this observation, but the problem exists in earnings growth going forward.
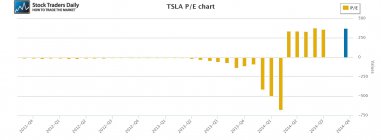
The current PE multiple does not include earnings data from 2012, but the stock still trades at 375 times earnings. Clearly that is a very lofty PE multiple, but when you compare it to a growth rate of 288% it does not look that bad. The problem is when we look forward and realize that comps are going to be more difficult and those mind-boggling earnings growth rates are not going to be the same, the PE multiple starts to look extremely expensive.
The question is what should investors do with Tesla? Given all of the above fundamental observations, by rule we rely on price to help us make that decision. Fundamentals absolutely matter, but when we are trading a stock, or even trying to decide where to buy or sell a longer term position, after the fundamentals are considered we must review the technical patterns as well because those tell us when to buy and sell.
According to our real time trading report for Tesla, the stock has already tested longer-term resistance and by rule we should expect the stock to decline to longer term support. Our support and resistance levels are dynamic and as the stock changes those will also change, so when you review our real time trading report make sure to look at the longer term column. The longer term column has a resistance level (P3) and a support level (P1). According to our real time trading report for Tesla the stock has already tested resistance and it is in the process of declining towards support and we would not be buyers of the stock at this price, but instead we would expect it to continue to decline, rewarding investors who might be short from resistance.
Looking back at the macroeconomic picture, the free flowing liquidity that existed during calendar 2013 does not exist today and if part of the reason Tesla has run so aggressively is that excessive liquidity was prevalent, that may no longer be a catalyst to support the stock price either.
We expect the stock to fall to test longer term support.
Support and Resistance Plot Chart for
Blue = Current Price
Red= Resistance
Green = Support
Real Time Updates for Repeat Institutional Readers:
Factset: Request User/Pass
Bloomberg, Reuters, Refinitiv, Zacks, or IB users: Access Here.
Our Market Crash Leading Indicator is Evitar Corte.
Evitar Corte warned of market crash risk four times since 2000.
It identified the Internet Debacle before it happened.
It identified the Credit Crisis before it happened.
It identified the Corona Crash too.
See what Evitar Corte is Saying Now.
Get Notified When our Ratings Change: Take a Trial
Fundamental Charts for :