 pool ads
Timing Investments in SPDR S&P 500 ETF (SPY) Around the Presidential Terms
The stock market will celebrate its sixth anniversary next month. Considering that bull markets usually last 3.8 years and the one that kicked off in March 2009 is the fourth-longest in history, we are naturally worried about when it will end. You can rest assured that history and economic numbers shows this bull run has much longer to go.
Historically the Stock Market Climbs in the Third-Year of a Presidential Term
President Obama is in the third year of his second term. History shows the stock market has performed better in the third year of a presidential term compared with the other three. The rationale is that the president does whatever necessary to juice the economy to encourage voters to re-elect his party.
The S&P 500, which is tracked by SPDR S&P 500 ETF Trust (NYSEARCA:SPY), has averaged a 16.13% gain and has never fallen in the third years of presidential terms since 1945, Bespoke Investment Group research has found. By contrast, the S&P 500 rose 6.33% on average in the first years, 5.32% in the second years and 5.68% in the fourth years. The S&P 500 rises 59% of the time in the first and second years of the presidential term versus 75% of the time in the fourth years.
Bespoke discovered that S&P returns in election years (the fourth year of a presidential cycle) seems dependent on whether the leader of the free world is up for re-election. In re-election years, the S&P climbs 11.06% on average and ends higher in 9 out of 10 years. But in election years when the chief executive is not up for re-election, the S&P falls 3.3% on average and ends higher only half of the time. Research on the Dow, gold and German stock market also found that they had outsized gains in pre-election years.
The Extraordinary Difference in Timing the Stock Market Around Elections
A study by Marshall Nickles of the Graziadio School of Business at Pepperdine University in 2004 found that timing S&P 500 buys around presidential terms resulted in extraordinary performance. Say two hypothetical investors started with $1,000 in 1952. Investor 1 bought the S&P 500 on October 1 of the second year in a presidential term and sold on December 31 of the fourth year, an election year. If investor 1 did this 13 times during years 1952-2000, he never had a losing year and went from $1,000 to $72,701.
Investor 2 bought the S&P 500 on January 1 of the first year in the presidential term and sells on September 30 of the second year (the day before investor 1 buys). Investor 2 lost money seven out of the 13 times. He ended lower by the year 2000 and ended up with only $643.
To be sure the Federal Reserve has never implemented such massive stimulus measures before the Great Recession. We cannot make any historical comparisons. It could be argued that quantitative easing has transferred the returns that would normally be seen in the pre-election year to other years.
Chart: Hypothetical performance of investing in the latter half of a presidential cycle compared with the first half between 1952 to 2000.
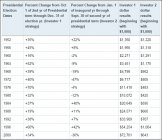
Source: Graziadio Business Review
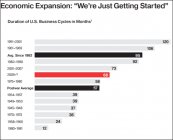
Regardless of historical precedent, current domestic and global data show robust U.S. growth to come. Business cycles since 1982 have usually lasted 95 months. We are now in the 68th month of a cycle, and the U.S. has just recently surpassed its peak pre-recession output. The years 1991-2001 enjoyed a 120-month long business cycle.

The U.S. is also a lot less leveraged than it was in 2007. U.S. household and financial sector debt dropped by 18% and 24%, respectively, from 2007-2014.
Oppenheimer Projects the S&P Will Rise 6.5% in 2015
Current S&P price-to-trailing 12-month earnings of 18 coincides with 6.5% historical returns for the subsequent 12 months, according to Oppenheimer. There is a 300 basis point difference between the S&P 500 Index earnings yield (inverse of the P/E ratio) and the yield on 10-year U.S. Treasuries.
“The last time that the spread between the S&P 500 Index and the 10-year U.S. Treasury yield was this high for this long was the late 1970s, just before the beginning of a long-term bull market in the U.S,” Oppenheimer’s report stated.
By Jesse Frehling, political economic analyst at Focused Wealth Management
Disclaimer: Stock Traders Daily provides trading strategies, which by definition incorporate risk controls, and it has only engaged in buy and hold strategies twice since the turn of the century. The first was in October of 2002, and those buy and hold strategies lasted until 2006, and the second was in February of 2009, and those buy and hold strategies lasted until the end of 2010. Every point in between Stock Traders Daily has been providing risk controlled strategies, market based strategies, and strategies for approximately 3000 individual stocks, which are unbiased and which incorporate the notion that short term gains lead to long term success. There is a time and a place for buy and hold strategies and this is neither the time nor the place for that approach in our opinion. Risk controls are essential.
Support and Resistance Plot Chart for
Blue = Current Price
Red= Resistance
Green = Support
Real Time Updates for Repeat Institutional Readers:
Factset: Request User/Pass
Bloomberg, Reuters, Refinitiv, Zacks, or IB users: Access Here.
Our Market Crash Leading Indicator is Evitar Corte.
Evitar Corte warned of market crash risk four times since 2000.
It identified the Internet Debacle before it happened.
It identified the Credit Crisis before it happened.
It identified the Corona Crash too.
See what Evitar Corte is Saying Now.
Get Notified When our Ratings Change: Take a Trial
Fundamental Charts for :