 pool ads
The PEG Ratio for Johnson & Johnson (NYSE:JNJ) Tells the Story
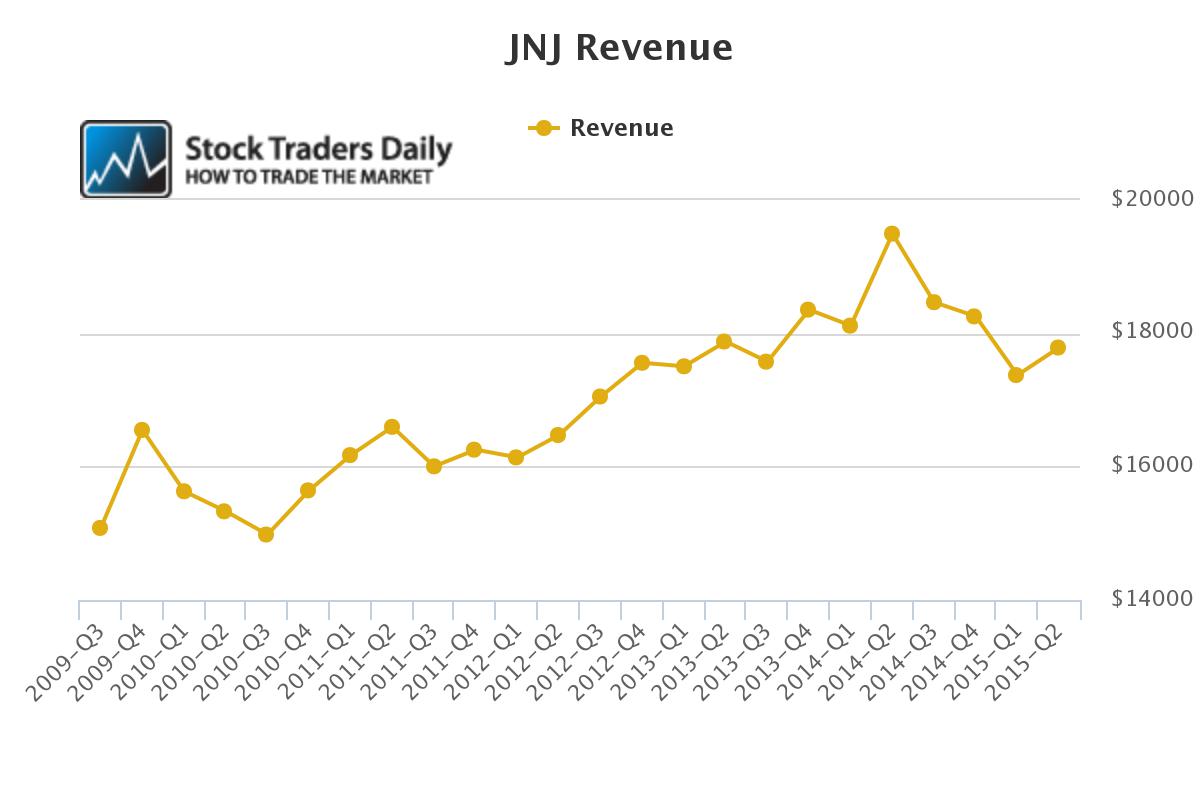
There has been a material stall and slight retracement and the revenue trend for Johnson & Johnson (NYSE:JNJ) and that presents serious concerns. Revenues have not declined like this since 2010, but the declines in revenue we are witnessing now our more significant than then.

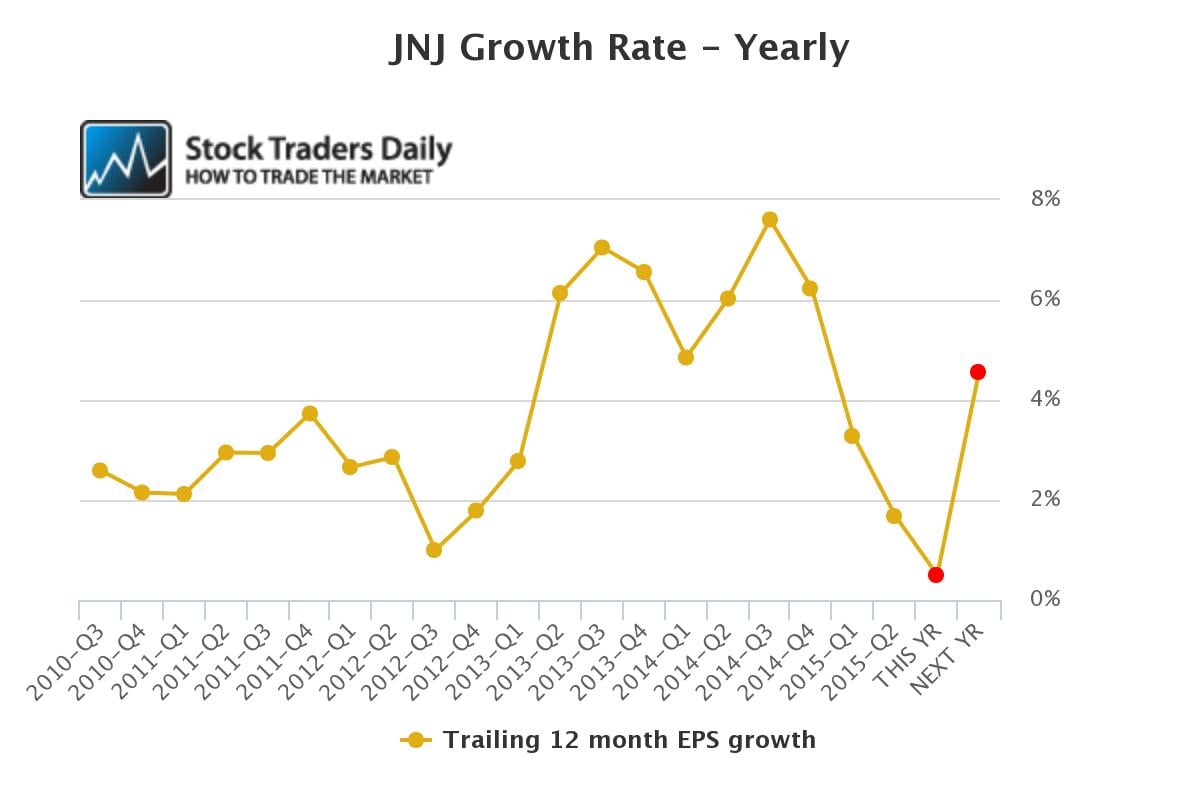
Not surprisingly, the decline in revenues is taking its toll on earnings growth and earnings growth on a year over year basis has already fallen from near 8% and it is expected to be barely above zero in calendar 2015, when everything is said and done. That means Johnson &Johnson is not expected to grow much at all this year, but a growth rate of about 4.5% is expected in calendar 2016.

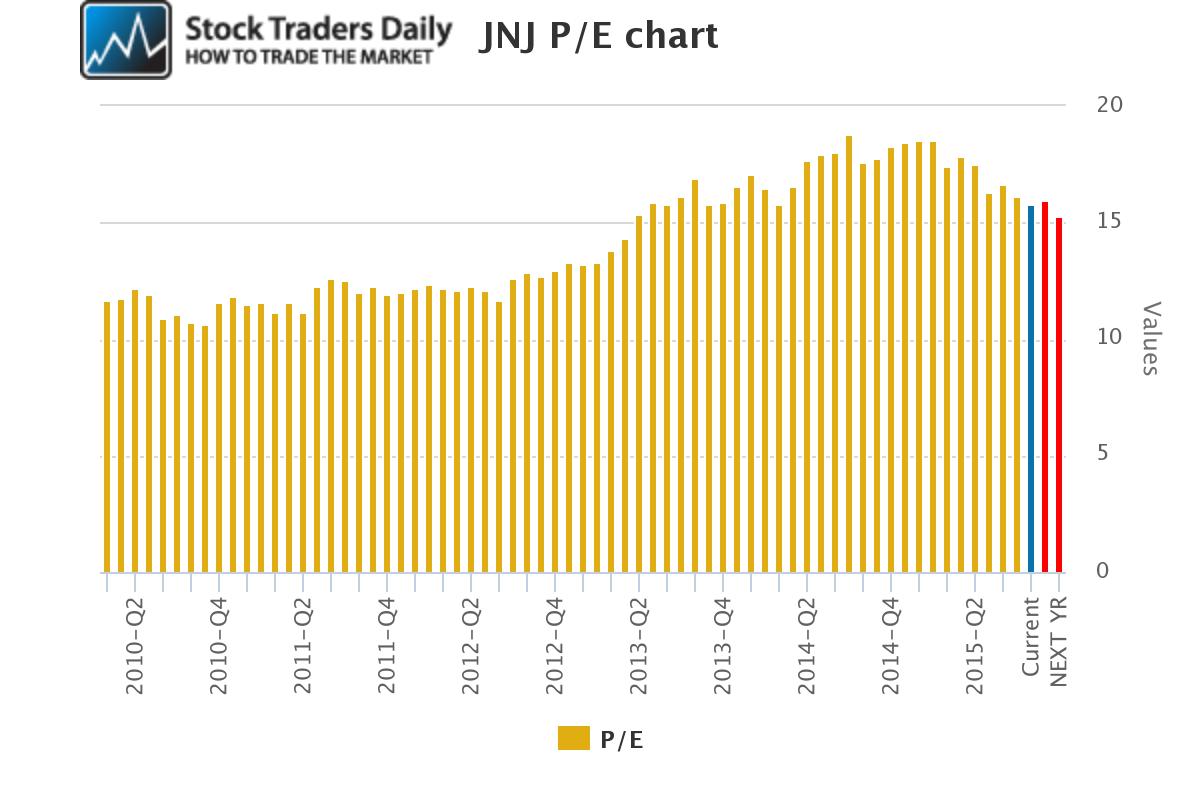
The expectation of that sharp reversal in earnings growth can calm some nerves, but when we compare that to the PE multiple concerns begin to surface in a more meaningful way. The current PE multiple is almost 16x, and revenue declines are taking place at a rate faster than back in 2010 when the PE multiple was closer to 11x. Back then the growth rate was between 2 and 3% on average on an annualized basis, which is higher than the growth rate today; even with the 4.5% projected growth rate in 2016 the growth rate that exists right now is about 2% on average.

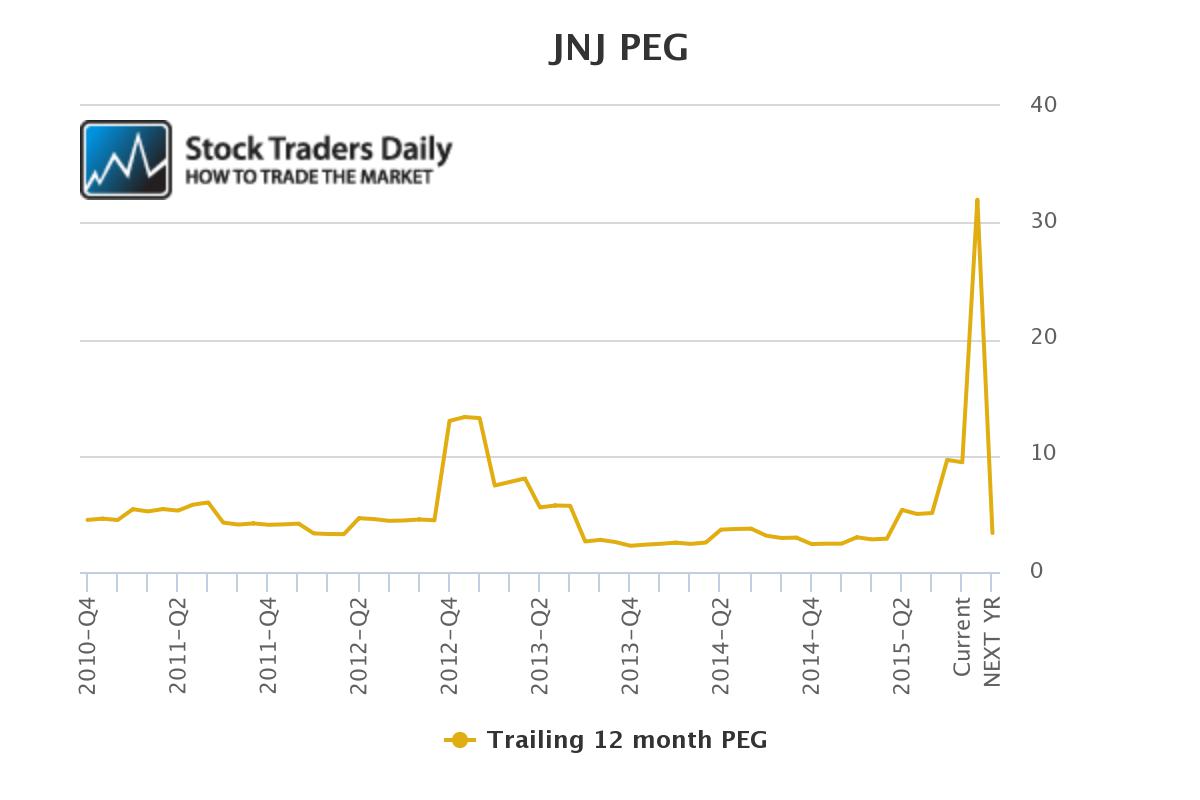
The question is one of valuation and the peg ratio chart for Johnson &Johnson makes this extremely tangible. The peg ratio already is pressing excessive levels but in calendar 2015, given the negligible earnings growth expectations the peg ratio shoots through the roof. Even in calendar 2016, if the snap back in earnings growth happens as expected, the peg ratio will still be 3.35, well above the range that we identify as fair value peg ratio valuation levels.

However, Johnson &Johnson has historically traded with a peg ratio that was above hour identified range of fair value, and over the recent years a peg ratio of around 2.5 was normal for Johnson &Johnson. Given its forward projections matching a peg ratio of 2.5 would require shares of Johnson &Johnson to fall meaningfully
Although this is considered to be a relatively conservative company in most circles we believe that risks have increased measurably, the declines in revenues are a serious concern, and the valuation currently placed on shares of Johnson &Johnson are excessive given its projected growth rate and historical PE multiples. This is no longer a stock we consider to be a safe haven.
Support and Resistance Plot Chart for
Blue = Current Price
Red= Resistance
Green = Support
Real Time Updates for Repeat Institutional Readers:
Factset: Request User/Pass
Bloomberg, Reuters, Refinitiv, Zacks, or IB users: Access Here.
Our Market Crash Leading Indicator is Evitar Corte.
Evitar Corte warned of market crash risk four times since 2000.
It identified the Internet Debacle before it happened.
It identified the Credit Crisis before it happened.
It identified the Corona Crash too.
See what Evitar Corte is Saying Now.
Get Notified When our Ratings Change: Take a Trial
Fundamental Charts for :