Predictive AI
Adds Alpha, Reduces Beta, Controls Risk
Unwinding the Russell - Dow Trade
Over the past couple of months the most popular trade on an institutional level has been to short the Russell 2000 (or buy the inverse ETFs) and buy the Dow. This has been a great trade, but it is important to understand why this is happening. Only then can we determine if it will continue to work. This article identifies rationale for this trade, the immediate probability, and the continued success.
Immediately, as this pre holiday week takes shape that popular trade is actually reversing itself and the Dow Jones industrial average has been weaker than the Russell 2000 over the past couple of days, but that can be as simple as this. Traditionally, short Sellers do not like holding short positions through extended weekends, this could be playing a role in the shift we are witnessing this week, and some institutions could be taking profits, but the technical patterns of the Russell 2000 also helped us identify this transition before it happened. This, however, does not change the longer term rationale for the trade that prompted the institutional decisions in the first place.
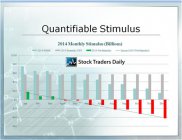
The reason this trade has worked so well in recent weeks is directly tied to liquidity levels in the Financial System. During calendar 2013 the Russell 2000 was exceptional and that is because liquidity injections flowed like water. Excess liquidity supported every hit to the market last year, but this year is different. As the FOMC tapers its bond buying program the excess liquidity in the Financial System is drying up. In fact, according to our observations, the excess liquidity in the Financial System is already a net negative.
Institutional investors recognize this, and they got ahead of the curve. That is why they shorted the Russell 2000, but if you are asking yourself why they bought the Dow Jones industrial average in conjunction with that short, you will need to further understand the progression that happens when liquidity levels dry up.
Money managers only get paid when your money is invested, so they want to keep you invested in something at all times. When liquidity levels dry up and risks become apparent on an institutional level money clearly flows out of the higher beta asset classes, but the money needs to find a home. That home is usually in stocks like those in the Dow Jones industrial average. Therefore, when risks are perceived to have increased and liquidity levels are perceived to have dried up institutional investors know that money will flow from the higher risk assets like those in the Russell 2000 to more conservative stocks like those in the Dow Jones industrial average.
For the past couple of months, institutional investors have been taking advantage of this, but this week that trade, at least in some circles, is being unwound. This may be solely due to the extended weekend that lies ahead, but we have pointed out the outperformance that is likely in the Russell 2000 and its associated EPS in advance, and although this week is not over, the unwinding of that trade in some circles at least is likely to continue for at least a short while.
Ultimately, our macro economic analysis (The Investment Rate) continues to suggest that downside market risks are significant, so although we find a trading opportunity in identifying the unwinding of the above referenced institutional trade this, we do not think this is a sustainable trade and we are not condoning buying and holding the Russell 2000 or the Dow Jones industrial average. This may work for the next few days so long as the ETFs hold their respective support levels.
For traders, consider the ETFs for the Russell for a short term trade. Both iShares Russell 2000 Index (ETF) (NYSEARCA:IWM) and ProShares Ultra Russell2000 (ETF) (NYSEARCA:UWM) can be attractive as this week comes to an end.
⚠Triggers may have already come
Support and Resistance Plot Chart for
Blue = Current Price
Red= Resistance
Green = Support
Real Time Updates for Repeat Institutional Readers:
Factset: Request User/Pass
Bloomberg, Reuters, Refinitiv, Zacks, or IB users: Access Here.
Our Market Crash Leading Indicator is Evitar Corte.
Evitar Corte warned of market crash risk four times since 2000.
It identified the Internet Debacle before it happened.
It identified the Credit Crisis before it happened.
It identified the Corona Crash too.
See what Evitar Corte is Saying Now.
Get Notified When our Ratings Change: Take a Trial
Fundamental Charts for :