 pool ads
Valuation analysis for 3M Co (NYSE:MMM)
This valuation analysis is the seventh in a series of reports that will at its end cover all 30 of the DJIA components. The goal of these combined reports is to paint a clearer picture of the current valuation of the DJIA as that related directly to earnings growth and relative PE. The raw data and all charts and graphs for these reports are already available to subscribers of Stock Traders Daily.
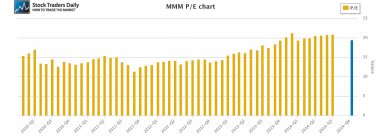
When looking closely at 3M Co (NYSE:MMM) we can see that the multiple has expanded quite aggressively between 2012 and now, going from about 15x to about 20x. This tells us that much of the stock price appreciation has been due to multiple expansion, and it begs questions about validity. Have the recent increases been supported by earnings growth?
The answer is yes, and analyst's expectations suggest continued earnings growth too.
According to our yearly growth rate chart, which compares trailing 12 month EPS data to the same period of last year to define yearly growth, the multiple expansion in MMM stock started at almost the exact time as yearly earnings growth began to accelerate. In Q2 2013 Yearly EPS growth was about 2%, but most recently yearly EPS growth was about 9%. That growth has been reflected in the multiple and the multiple expansion seen at MMM is validated.

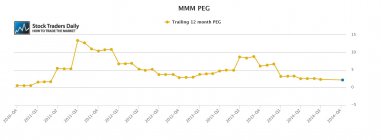
Fundamentally, MMM appears to be operating efficiently and although the PEG ratio for MMM is over 2 the stock does not look as overpriced as many other stocks given the corresponding EPS growth that has accompanies the price appreciation.
Technical Take:
According to our real time trading report for MMM the stock is breaking longer term support, and that opens the door for additional decline. This is a technical red flag and so long as the stock remains below former levels of longer term support, which have now been converted into resistance, additional decline will be expected according to our report. There have already been sell signals accordingly.
Summary:
Although the multiple expansion was accompanied by earnings growth, the stock price for MMM is providing warnings. As an investor you need to ask yourself what is more important. If your decision is that price is more important, and if you think that smart money investors react before analysts adjust their numbers, or that the recent multiple expansion may have been a little too much, then the break of longer term support that has happened in MMM should be very important to you.
Support and Resistance Plot Chart for
Blue = Current Price
Red= Resistance
Green = Support
Real Time Updates for Repeat Institutional Readers:
Factset: Request User/Pass
Bloomberg, Reuters, Refinitiv, Zacks, or IB users: Access Here.
Our Market Crash Leading Indicator is Evitar Corte.
Evitar Corte warned of market crash risk four times since 2000.
It identified the Internet Debacle before it happened.
It identified the Credit Crisis before it happened.
It identified the Corona Crash too.
See what Evitar Corte is Saying Now.
Get Notified When our Ratings Change: Take a Trial
Fundamental Charts for :