 pool ads
Valuation analysis for Acxiom Corporation (NASDAQ:ACXM)
Can technical reversals of trend in the stock be leading indicators to future improvements in EPS and Revenue Growth? It has certainly happened before, and it will certainly happen again, but it is not a steadfast rule and therefore not set in stone.
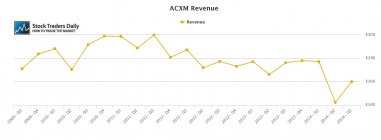
Deteriorating revenue is a major concern for Acxiom Corporation (NASDAQ:ACXM). In addition, the sporadic EPS results are not attractive to growth oriented investors either, making the PE multiple of 25 times earnings look rather rich.
Our evaluation of earnings growth is based on earnings from operations, which excludes onetime events, and we use trailing 12 month data to compare earnings on an annualized basis to define earnings growth trends. Our yearly earnings growth chart below suggests that Acxiom has actually seen a contraction in earnings growth as of the most recent quarter.
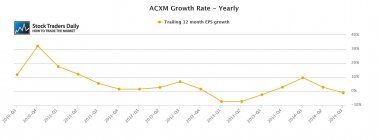
Therefore, not only have revenues been declining, but earnings contractions are occurring, and this is happening while the stock itself is trading with a PE multiple over 25 times earnings.
Technical take:
According to our real time trading report for Acxiom the stock recently managed to increase over the converted resistance line in our longer term patterns, it did this after breaking down meaningfully and developing a longer term downward sloping channel, but by definition if the stock remains above this recently broken resistance level, which has now been converted into support, we would be buyers. That converted support level is our risk control, however, and if the stock breaks back below that level again we should sell the stock by rule.
Summary:
On a fundamental basis Acxiom looks rich. The PE multiple does not appear to be warranted given the lackluster growth rate and the declining revenue trends, but the stock did recently reverse higher. It is one of the few stocks that are in longer-term downward sloping channels, however, but it did recently break above downward sloping resistance and technically that is a positive sign. On a technical basis the stock appears to be a buy so long as it remains above the recently broken longer term resistance lines, but fundamentally the stock still appears to be overvalued. Unless earnings and revenue begin to turn higher we would not expect the fundamentals to improve, but sometimes technical indicators are leading indicators and if the recent break above longer-term downward sloping resistance is a leading indicator for Acxiom improvements in both earnings and revenue could lie ahead.
Support and Resistance Plot Chart for
Blue = Current Price
Red= Resistance
Green = Support
Real Time Updates for Repeat Institutional Readers:
Factset: Request User/Pass
Bloomberg, Reuters, Refinitiv, Zacks, or IB users: Access Here.
Our Market Crash Leading Indicator is Evitar Corte.
Evitar Corte warned of market crash risk four times since 2000.
It identified the Internet Debacle before it happened.
It identified the Credit Crisis before it happened.
It identified the Corona Crash too.
See what Evitar Corte is Saying Now.
Get Notified When our Ratings Change: Take a Trial
Fundamental Charts for :