 pool ads
Valuation analysis for Alliance Data Systems Corporation (NYSE:ADS)
Some stocks grow faster than others, and when we find stocks like this it is important for us to make note of them. It is not always right to chase the stocks when they run, but it can be rewarding to buy them when they dip.
Alliance Data Systems Corporation (NYSE:ADS) is a company with excellent earnings growth and corresponding revenue growth, a relationship that we think is excellent. Our observations also suggest that the stock is an excellent trading vehicle, while being fundamentally sound.
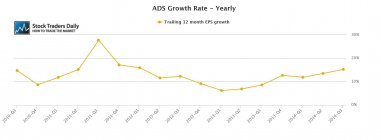
First, we evaluate earnings growth using trailing 12 month data and we exclude onetime events to properly identify earnings from operations. We compare the data on a yearly basis to compile yearly EPS growth trends and as of the last report Alliance Data Systems was growing at 15.26%.
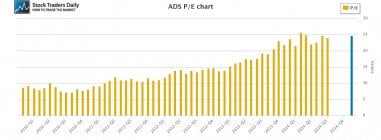
There has clearly been multiple expansion over the past few years as the stock went from 15 times earnings to about 25 times earnings, but the multiple expansion was warranted given the growth rate and if Alliance Data Systems is capable of maintaining its growth rate it will appear attractive on a fundamental basis.
Technical take:
According to our real time trading report for alliance Data Systems the stock is very close to a level of longer-term resistance after testing longer term support a few short weeks ago. The upside, as a result, looks limited on a fundamental basis and that means the upside price target is close. Given the volatility associated with the stock and the potential for declined from resistance to support, we would, by rule, suggest selling this stock at resistance with the intention of buying back when support levels were tested.
Summary:
Alliance Data Systems is growing nicely, it is attractive on a fundamental basis, but the stock has recently increased aggressively and it is much closer to resistance than support. As a result, we expect limited upside and we would be Sellers of the stock at resistance with the expectation that the stock decline back to longer term support again thereafter. Given the attractive fundamental characteristics, the stock would be attractive as a buy again at longer term support.
Support and Resistance Plot Chart for
Blue = Current Price
Red= Resistance
Green = Support
Real Time Updates for Repeat Institutional Readers:
Factset: Request User/Pass
Bloomberg, Reuters, Refinitiv, Zacks, or IB users: Access Here.
Our Market Crash Leading Indicator is Evitar Corte.
Evitar Corte warned of market crash risk four times since 2000.
It identified the Internet Debacle before it happened.
It identified the Credit Crisis before it happened.
It identified the Corona Crash too.
See what Evitar Corte is Saying Now.
Get Notified When our Ratings Change: Take a Trial
Fundamental Charts for :