 pool ads
Valuation analysis for Apollo Education Group Inc (NASDAQ:APOL)
This article attempts to define the fair value for Apollo Education Group Inc (NASDAQ:APOL). Ours is an earnings focused valuation approach which combines fundamental and technical observations to better define not only fair value but to also better define more precise entry and exit levels that foster more profitable trades.
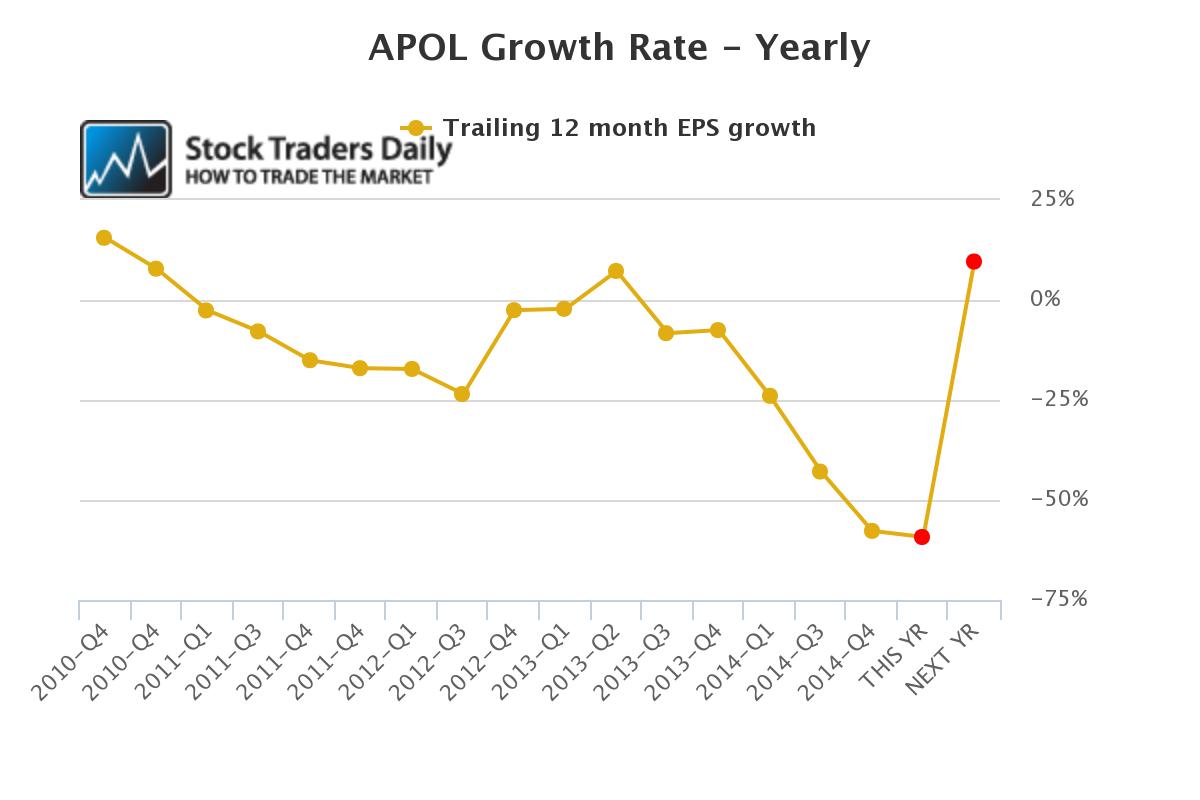
First, we weed out onetime events and evaluate complete earnings cycles to develop our yearly EPS growth rate chart, and it is safe to say that the growth rate at APOL has been awful of late. As of the most recent quarter growth was about -57% and if analysts are right about the current quarter growth will fall to -59%, represented by the first red dot in our chart.

However, the second red dot represents what analysts expect for 2016, and that suggests a material rebound in the growth rate, and it is 9.62% respectively. One could argue that this is due to easy comps, but clearly some degree of improvement is finally being expected.
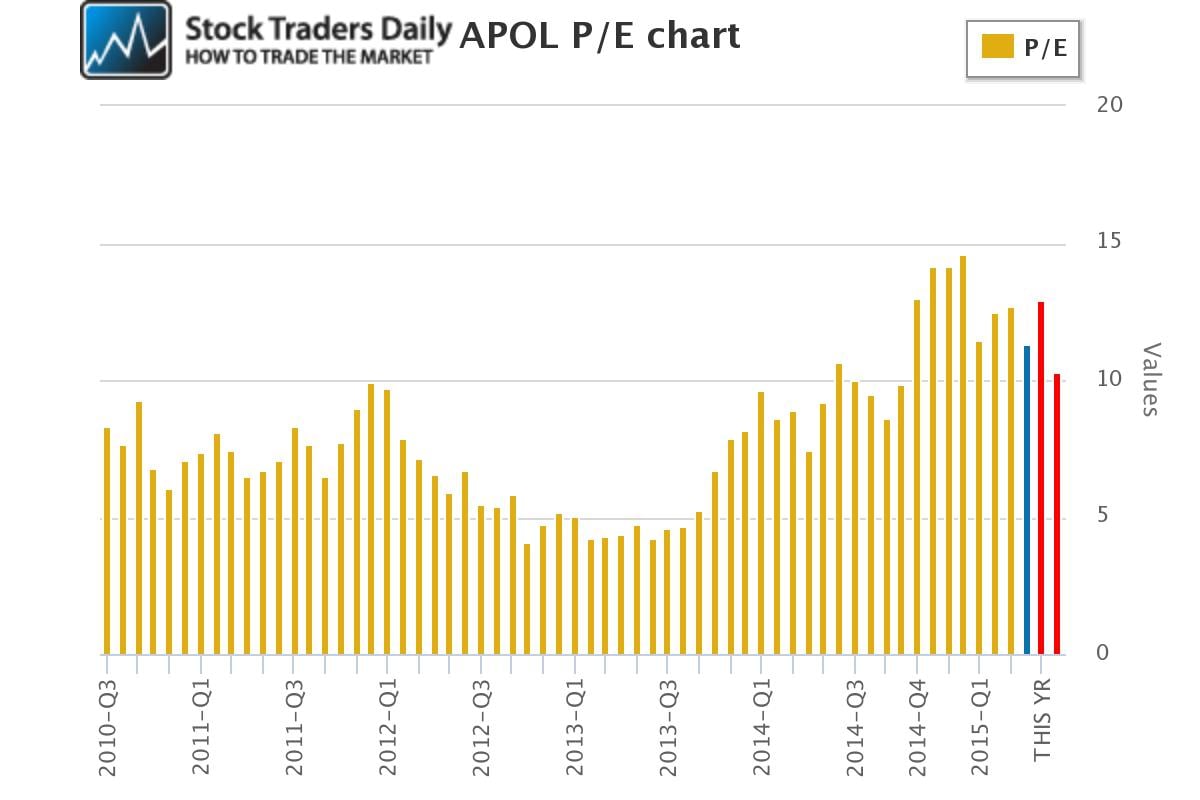
Not surprisingly, the PE multiple for APOL has fallen, and it is currently 11.28, but according to analysts, if price remains the same and they are right about 2015 results the PE multiple will be 12.94 by the end of 2015 (first red bar) but fall to 10.29 by the end of 2016 (second red bar) if they are right about that year too.

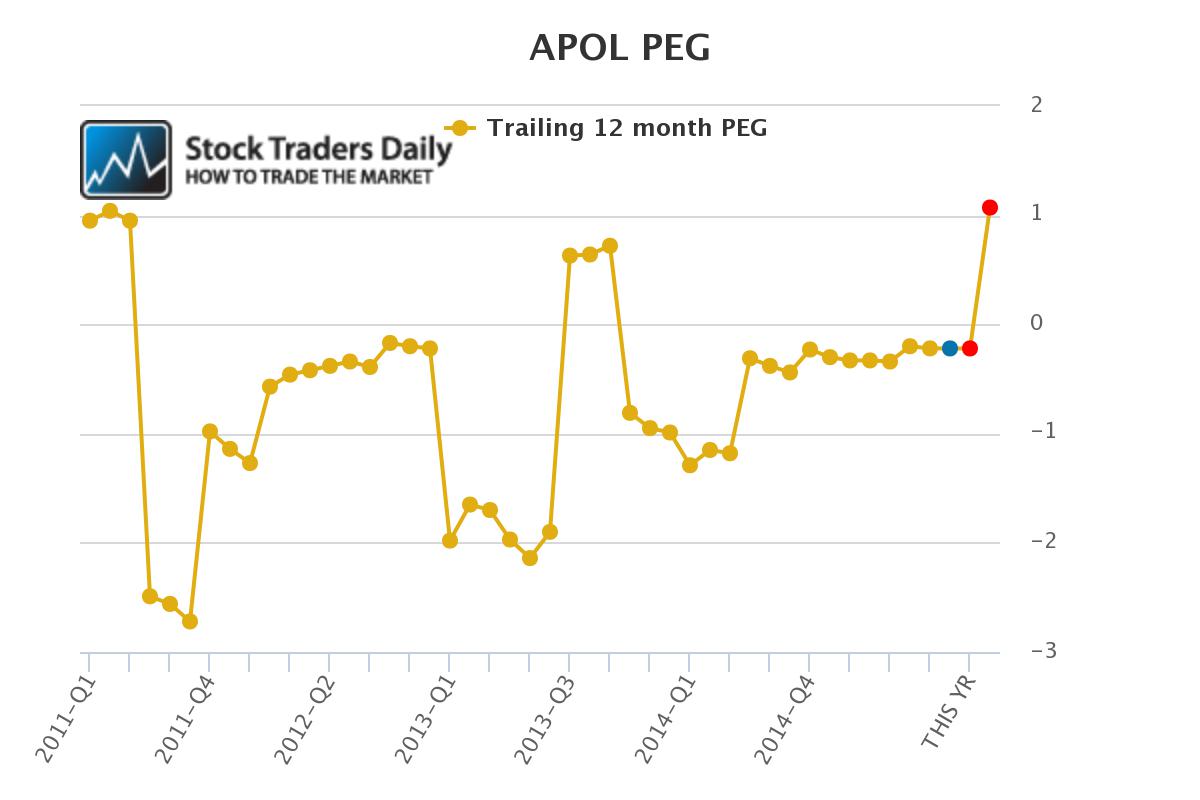
This combination allows us to better define fair value using a PEG ratio approach. Our definition of fair value is when a company trades with a PEG ratio between 0 and 1.5, but the current PEG for APOL is negative, it is expected to be negative for 2015 too, but improve to 1.07 by the end of 2016 if analysts are right and price remains the same. 2016 PEG is the second red dot.

So should price remain the same?
Our technical observations tell us that APOL just tested a level of longer term support and if it holds we would expect the stock to mount a meaningful recovery back towards longer term resistance. That means APOL has flashed buy signals, but the stock must hold longer term support for that to remain true. Longer term support is defined in our real time trading report for APOL as the P-1 parameter. If it breaks we would exit this trade, but if it holds APOL looks like it can move higher from here.
Clearly, on a fundamental basis investors must look beyond 2015 to see light at the end of the tunnel, but it seems as if some are, so this test of support could be supported by that as well.
Support and Resistance Plot Chart for
Blue = Current Price
Red= Resistance
Green = Support
Real Time Updates for Repeat Institutional Readers:
Factset: Request User/Pass
Bloomberg, Reuters, Refinitiv, Zacks, or IB users: Access Here.
Our Market Crash Leading Indicator is Evitar Corte.
Evitar Corte warned of market crash risk four times since 2000.
It identified the Internet Debacle before it happened.
It identified the Credit Crisis before it happened.
It identified the Corona Crash too.
See what Evitar Corte is Saying Now.
Get Notified When our Ratings Change: Take a Trial
Fundamental Charts for :