 pool ads
Valuation analysis for Automatic Data Processing (NASDAQ:ADP)
Fair valuation is sometimes a subjective observation, but one that is based on a combination of earnings growth and revenue, which ultimately defines how much we as investors are willing to pay for a particular security. Sometimes, they say, fair valuation is whatever someone is willing to pay, but in financial circles fair valuation can be quantified.
For Automatic Data Processing (NASDAQ:ADP) fair valuation is something that investors in the stock who also expect it to increase substantially from current levels may not want to admit. According to our observations ADP looks extremely overvalued and material concerns exist.
First, earnings have not been growing at a stellar rate, and our observations of the yearly earnings growth rate for ADP suggest that current growth is 3%, a growth rate lower than the company has seen since before 2011.
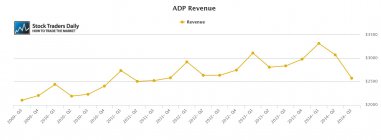
In addition, quarterly revenues have begun to decline measurably and revenues for ADP have not been this low since the third quarter of 2011 either.
This combination of deteriorating revenue and lackluster earnings can become a major concern, especially when the stock's price increases relentlessly. In fact, at current levels shares of ADP have a peg ratio over 9.
Technical take:
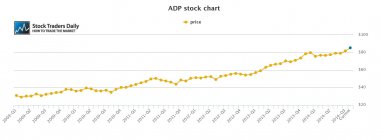
According to our real time trading report for ADP the stock is near the level of longer-term resistance and by rule we would be Sellers and potential short Sellers of the stock near longer-term resistance levels. Our technical observations suggest that the stock can fall from resistance to support.
Summary:
According to our fundamental observations, ADP looks significantly overvalued based on its earnings and revenue trajectory, its peg ratio is enormous, and the stock is very close to a level of longer-term resistance. We would be Sellers and/or short Sellers of the stock accordingly.
Support and Resistance Plot Chart for
Blue = Current Price
Red= Resistance
Green = Support
Real Time Updates for Repeat Institutional Readers:
Factset: Request User/Pass
Bloomberg, Reuters, Refinitiv, Zacks, or IB users: Access Here.
Our Market Crash Leading Indicator is Evitar Corte.
Evitar Corte warned of market crash risk four times since 2000.
It identified the Internet Debacle before it happened.
It identified the Credit Crisis before it happened.
It identified the Corona Crash too.
See what Evitar Corte is Saying Now.
Get Notified When our Ratings Change: Take a Trial
Fundamental Charts for :