 pool ads
Valuation analysis for Boeing Co (NYSE:BA)
Boeing Co (NYSE:BA) is a very interesting company because earnings have been growing rapidly, revenue has been accelerating, and current valuations look attractive. However, the fair value of Boeing largely rests on the ability of the company to meet analysts' expectations, so it is important for us to evaluate what shares of Boeing will look like if analyst's expectations are met.
More specifically, this evaluation attempts to define the fair value of Boeing looking ahead given those expectations, with the assumption that Boeing actually will meet those expectations going forward.
In this evaluation I am using trailing 12 month data populated on a quarterly basis and compared year over year to define a yearly growth rate chart for the earnings growth at Boeing. I am also using raw EPS Data as a reference, but it is this EPS growth rate chart that is most important to this initial observation. From the raw EPS numbers we can see that the EPS data has been relatively flat over the past few quarters, but that does not show up in the yearly growth rate chart for the current quarter.
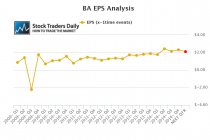
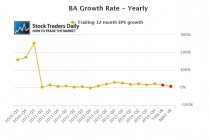
Instead, the flat line that we can see in the raw EPS Data does not show up until the forward looking estimates for this year and next year. Currently, the growth rate still looks very attractive because the comps are not based on the past few quarters, but instead compared year over year using that trailing 12 month observation. When this year is over, however, the comps will absolutely include the flat line we have seen recently, and that changes the forward looking valuation metrics for Boeing.
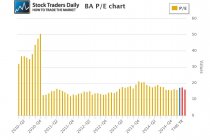
Reasonably, if Boeing matches analysts current estimates for this year and next year the PE multiple at Boeing will not change materially, but because the underlying growth rate of the company is expected to come down from what it has been the valuation will absolutely change.
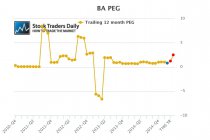
The growth rate for the fourth quarter of 2014 was over 21%, the growth rate this year is expected to be over 14%, but next year the growth rate is expected to fall to just over 6%. This data, when compared to the PE multiple, produces current and forward looking peg ratios and from these observations we can gauge the future valuation more accurately.
Our peg ratio valuation shows us that although the current peg ratio for Boeing looks attractive, it will increase from 0.81 to 2.51 if analysts' estimates are correct. That suggests that the future fair value of Boeing will be less than it is today if analysts are correct.
This observation assumes that fair value is a measure of earnings and earnings growth, and investors approach their decisions to invest with an evaluation of what they are willing to pay for future earnings growth. If earnings growth is expected to decline measurably at Boeing, we would think that investors might question the multiple they are willing to pay for Boeing soon.
Technical take:
According to our real time trading report for Boeing the stock has broken above its longer term resistance level and so long as that is true Boeing will have a bullish bias and we would expect higher levels. Only if Boeing breaks back below longer term converted support, the former resistance levels that were converted into support when they broke, would this positive bias change. If that happens, however, the fundamental concerns addressed above will likely come into play.
At this particular juncture the technical observations diverge from the fundamental observations and therefore we expect additional upside until such time as the stock reverses back below longer term converted support as that is defined in our combined analysis for Boeing.
Disclaimer: Stock Traders Daily provides trading strategies, which by definition incorporate risk controls, and it has only engaged in buy and hold strategies twice since the turn of the century. The first was in October of 2002, and those buy and hold strategies lasted until 2006, and the second was in February of 2009, and those buy and hold strategies lasted until the end of 2010. Every point in between Stock Traders Daily has been providing risk controlled strategies, market based strategies, and strategies for approximately 3000 individual stocks, which are unbiased and which incorporate the notion that short term gains lead to long term success. There is a time and a place for buy and hold strategies and this is neither the time nor the place for that approach in our opinion. Risk controls are essential.
Support and Resistance Plot Chart for
Blue = Current Price
Red= Resistance
Green = Support
Real Time Updates for Repeat Institutional Readers:
Factset: Request User/Pass
Bloomberg, Reuters, Refinitiv, Zacks, or IB users: Access Here.
Our Market Crash Leading Indicator is Evitar Corte.
Evitar Corte warned of market crash risk four times since 2000.
It identified the Internet Debacle before it happened.
It identified the Credit Crisis before it happened.
It identified the Corona Crash too.
See what Evitar Corte is Saying Now.
Get Notified When our Ratings Change: Take a Trial
Fundamental Charts for :