 pool ads
Valuation analysis for Cisco Systems, Inc. (NASDAQ:CSCO)
This valuation analysis is the fourth in a series of reports that will at its end cover all 30 of the DJIA components. The goal of these combined reports is to paint a clearer picture of the current valuation of the DJIA as that related directly to earnings growth and relative PE. The raw data and all charts and graphs for these reports are already available to subscribers of Stock Traders Daily.
Let's face it, Cisco Systems, Inc. (NASDAQ:CSCO) is not the company it used to be, but EPS growth has been steady if you discount the dismal Q4 2013 result. Both EPS and Revenue got hit hard in Q4 2013, and although we could discount that in our observations it is probably best that we include it because these were results from operations. We are not concerned with the rationale, but we can clearly see that both EPS and Revenue have gotten back on track after that hiccup.


The problem is that the corresponding EPS growth rate for CSCO has turned negative on a trailing 12 month basis. Our analysis discounts one-time events to review earnings from operations more closely, and although we can argue that things would look better if we discount Q4 2013 results, we are not going to do that. As a result, we are looking at a negative trailing 12 month yearly growth rate for CSCO at this time.
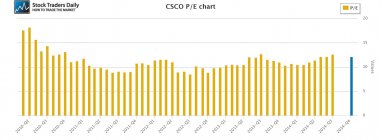
In addition, something of concern, the PE multiple for CSCO is near a relative high. It is trading near 12x earnings, and that is its relative peak in PE since 2011, with 10x being its trough. That begs the question; will we see 10x again?
Technical Take:
According to our real time trading report for CSCO the stock has been bouncing off of longer term support. We saw that happen twice over the past couple of months, but the stock has not yet increased to test resistance. That means support is important, and we would expect the stock to progress towards longer term resistance if support holds. Support must hold though, so it also acts as risk control.
Summary:
Although CSCO is not the company it once was, and although there absolutely was a hiccup in Q4 2013, the trajectory of both EPS and Revenue is positive, and if the longer term support level holds we would expect the stock to increase towards resistance and the slow but steady growth rate that marks EPS and Revenue, which is also supported by analysts estimates, to continue. It is critical that support holds though. If it breaks the multiple could contract to near 10 without any other hiccups in EPS or Revenue.
After all, even with the growth that has been realized, the growth is still relatively slow.
Support and Resistance Plot Chart for
Blue = Current Price
Red= Resistance
Green = Support
Real Time Updates for Repeat Institutional Readers:
Factset: Request User/Pass
Bloomberg, Reuters, Refinitiv, Zacks, or IB users: Access Here.
Our Market Crash Leading Indicator is Evitar Corte.
Evitar Corte warned of market crash risk four times since 2000.
It identified the Internet Debacle before it happened.
It identified the Credit Crisis before it happened.
It identified the Corona Crash too.
See what Evitar Corte is Saying Now.
Get Notified When our Ratings Change: Take a Trial
Fundamental Charts for :