 pool ads
Valuation analysis for Devon Energy Corp (NYSE:DVN)
Does Devon Energy Corp (NYSE:DVN) deserve to have been beaten down this much? Let's take a look and see.
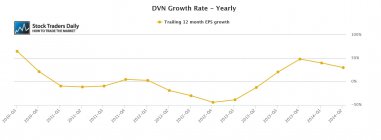
Our evaluation begins with EPS growth, and specifically when we review EPS growth we look at trailing 12 month yearly EPS growth to determine how the company is growing. Furthermore, we remove onetime events and focus on earnings from operations so as to better define the growth from the company without extracurricular items. Our review of the earnings growth for Devon Energy shows us that earnings growth looked horrible in the fourth quarter of 2012, but since then earnings growth has been outstanding and reached 48% as of the fourth quarter of 2013.
The problem is the comps were very easy and as the fourth quarter of 2013 rolled around the comparisons to the previous year made earnings growth look remarkable. That brings our attention to current estimates and forward estimates, which suggest a slower growth rate for Devon Energy. This also helps us understand what fair value should be. The forward growth rate for Devon Energy based on consensus analyst estimates is about 7% for the next year. That provides a great starting point.
Our next step is to evaluate the PE multiple and our evaluation shows us, not surprisingly, that the PE multiple peaked in August of 2012 near 20 times earnings and has deteriorated to where it is now since then. Currently, the PE multiple is slightly over 11 times earnings. Given the growth rate that exists now, that puts the trailing 12 month peg ratio at 0.38, but if future growth is going to be slower that will need to be adjusted too. Given the expectation of 7% going forward, a much more appropriate peg ratio of 1.62 is applied to our observation.
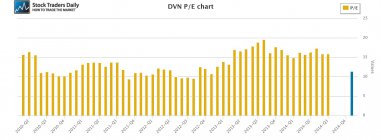
The question then becomes, does Devon Energy look good with a peg ratio of 1.62?
Technical take:
According to our real time trading report for Devon Energy the company has fallen from longer-term resistance to test longer term support and at the time this was written the stock was bouncing from longer term support slightly. If the stock continues to increase without breaking longer term support we will expect the stock to continue higher until such time as longer-term resistance levels are tested again. Longer term support acts as our inflection parameter and our risk control appropriately.
Summary:
According to our observations the decline in Devon Energy has brought the stock to a point where it is a technical buy, and the associated forward looking peg ratio does not look out of line. Clearly, the company will not be growing at 38%, at least that would be a surprise, but at even a moderate 7% growth rate the current PE multiple of 11 times earnings is reasonable and therefore so long as longer-term support levels remain intact Devon Energy looks attractive near these levels. If support breaks, get out, but so long as support remains intact we will expect a test of longer-term resistance again.
Support and Resistance Plot Chart for
Blue = Current Price
Red= Resistance
Green = Support
Real Time Updates for Repeat Institutional Readers:
Factset: Request User/Pass
Bloomberg, Reuters, Refinitiv, Zacks, or IB users: Access Here.
Our Market Crash Leading Indicator is Evitar Corte.
Evitar Corte warned of market crash risk four times since 2000.
It identified the Internet Debacle before it happened.
It identified the Credit Crisis before it happened.
It identified the Corona Crash too.
See what Evitar Corte is Saying Now.
Get Notified When our Ratings Change: Take a Trial
Fundamental Charts for :