 pool ads
Valuation analysis for Exxon Mobil Corporation (NYSE:XOM)
This valuation analysis is the ninth in a series of reports that will at its end cover all 30 of the DJIA components. The goal of these combined reports is to paint a clearer picture of the current valuation of the DJIA as that related directly to earnings growth and relative PE. The raw data and all charts and graphs for these reports are already available to subscribers of Stock Traders Daily.
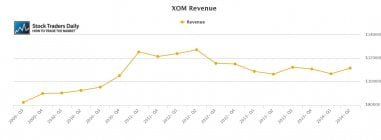
Exxon Mobil Corporation (NYSE:XOM) has had poor earnings and revenue growth in recent quarters. Revenues, in fact, have been flat-lining since Q2 2011, and during that time EPS growth has turned negative a number of times. The question is, will this trend continue, and if it does is XOM fairly priced at these levels?
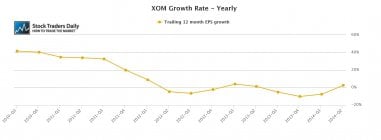
Our valuation analysis is an earnings driven approach, and we focus on trailing 12 month EPS comparisons to draw conclusions about growth from operations. We also exclude onetime events to get the closest possible look at earnings from operations, and from that we can see that EPS growth turned positive after the last earnings report, but that was after three consecutive negative reports in a row. That means we cannot consider this past quarter to be representative of future results, especially when revenue growth has not increased proportionally.
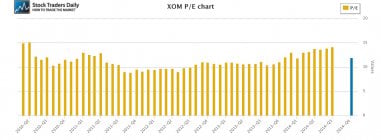
In addition, we can see that the stock has already pulled back some, and that pullback was absolutely warranted. XOM experienced aggressive multiple expansion in the face of deteriorating EPS and Revenue growth, the PE when from near 10x to over 14x without EPS growth, and it now rests at 11.9x. It is still rich looking though given the no-growth situation the company is still facing. In fact, unless EPS growth strengthens next quarter, a 10x multiple is not unreasonable. That would mean a 19% pullback everything else held constant.
Technical take:
According to our real time report for XOM the stock is resting right on a longer term support level. This is a pivot point for the shares, and if longer term support holds we should expect a complete oscillation to longer term resistance as that is defined in our report, but if it breaks, because there are NO additional support levels in our report, we would expect aggressive declines.
Summary:
XOM has not been growing, revenues have not been increasing, and the stock trades at a multiple that suggests growth from operations, but if the company cannot produce EPS growth we would expect that multiple to contract back to near 10x. The longer term support levels the stock is facing now can be used as an indicator. If the stock holds support we would consider it to be a sign that smart money has confidence in the company to provide adequate results, but if the stock breaks the sign will be a red flag, suggesting that smart money is not willing to take that risk and has lost faith, at least for now.
Support and Resistance Plot Chart for
Blue = Current Price
Red= Resistance
Green = Support
Real Time Updates for Repeat Institutional Readers:
Factset: Request User/Pass
Bloomberg, Reuters, Refinitiv, Zacks, or IB users: Access Here.
Our Market Crash Leading Indicator is Evitar Corte.
Evitar Corte warned of market crash risk four times since 2000.
It identified the Internet Debacle before it happened.
It identified the Credit Crisis before it happened.
It identified the Corona Crash too.
See what Evitar Corte is Saying Now.
Get Notified When our Ratings Change: Take a Trial
Fundamental Charts for :