 pool ads
Valuation analysis for General Electric Company (NYSE:GE)
What is the fair value for General Electric Company (NYSE:GE)?
Our definition of fair value focuses on earnings and earnings growth in particular. We compare earnings growth to PE multiples to determine fair value and on that basis offer a fundamental evaluation which is then combined with our technical observations to better define specific entry and exit levels. Our earnings growth observations encompass complete earnings cycles to avoid seasonal anomalies and we exclude onetime events to focus on truer growth rates.
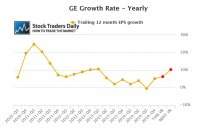
Our earnings growth observations for General Electric tell us that earnings growth actually was negative in the third quarter of 2014. Earnings growth did improve and in the fourth quarter earnings growth was 5.06%, and if analysts are right about their estimates for 2015 earnings growth will be approximately 6.21% as shown in the first red dot in our earnings growth chart.
Although earnings growth is not expected to be spectacular in 2015, analysts are expecting earnings growth to improve measurably in 2016, as shown in our second red dot, where they are expecting 10.24% earnings growth. Clearly, analysts are expecting earnings growth rates to about double by the end of next year, and that provides some light at the end of the tunnel for General Electric investors.
This allows us to focus on the PE multiple, and the PE multiple for General Electric is currently 16.54, as shown by the blue bar in our PE chart. The first red bar is the multiple that would be if analysts are right about their estimates for 2015 and price remains the same, that's 15.87, and the second red bar represents 2016 data and is 15.01.
This combination of earnings growth and PE multiple analysis allows us to define fair value using a peg ratio approach. Our definition of fair value is when a company trades with a peg ratio between zero and 1.5. Because General Electric recently had negative earnings growth the peg ratio recently showed dramatic decline, but currently the peg ratio, represented by the blue dot in our peg ratio chart, is positive again and at 3.08. That is well above our range, however, and so is the peg ratio that would be if analysts are right about 2015, the first red dot, which is 2.56. Not until the end of 2016 will the peg ratio get down to within our range, the second red dot shows that value at 1.47, but even then the peg ratio would be at the high end of our range.
That begs the question, should price remain the same or should price change as earnings growth results come in and valuation metrics themselves change?
To answer that question our attention shifts to our technical parameters. It is safe to say that on a fundamental valuation basis General Electric currently looks rich, its price based on its earnings growth rate is higher than it should be, and if price remains the same and analysts are right about their expectations the stock would not look fairly valued until the end of 2016, which opens the door to all kinds of volatility between then and now, but something important recently happened to price that must be observed.
With all of the fundamental concerns, the stock recently broke above our longer-term resistance level. It was not substantially higher than our longer-term resistance level at the time I wrote this, but the break above longer term resistance was absolutely bullish and because price is what makes us money in the stock market we must respect the price action we are witnessing. If General Electric remains above the former level of longer-term resistance that we have identified in our real time trading report for General Electric we are expecting the stock to continue to move higher. That level, which has now been converted into a support level, also acts as our risk control and if the stock begins to break back below this level again we would exit any long positions in General Electric. If the stock begins to break back technical red flags will surface and support the fundamental red flags that already exist.
Currently, the technical indicators are positive while the fundamental indicators are not.
Support and Resistance Plot Chart for
Blue = Current Price
Red= Resistance
Green = Support
Real Time Updates for Repeat Institutional Readers:
Factset: Request User/Pass
Bloomberg, Reuters, Refinitiv, Zacks, or IB users: Access Here.
Our Market Crash Leading Indicator is Evitar Corte.
Evitar Corte warned of market crash risk four times since 2000.
It identified the Internet Debacle before it happened.
It identified the Credit Crisis before it happened.
It identified the Corona Crash too.
See what Evitar Corte is Saying Now.
Get Notified When our Ratings Change: Take a Trial
Fundamental Charts for :