 pool ads
Valuation analysis for General Electric Company (NYSE:GE)
This valuation analysis is the tenth in a series of reports that will at its end cover all 30 of the DJIA components. The goal of these combined reports is to paint a clearer picture of the current valuation of the DJIA as that related directly to earnings growth and relative PE. The raw data and all charts and graphs for these reports are already available to subscribers of Stock Traders Daily.
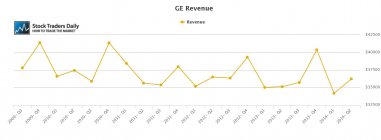
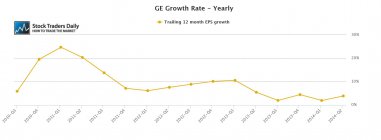
General Electric Company (NYSE:GE) has been growing EPS solidly recently, but trailing 12 month yearly EPS growth was only 3.87% last quarter and that has been declining from prior results, so our goal here is to identify relative value given that growth rate. The company is traditionally a rather slow growing company, and the flat-line in the Revenue Chart below emphasizes that, but that has not stopped the stock from increasing. The problem, however, exists in relative valuation, so let's take a closer look.
Even with solid recent growth (relatively speaking), the PE multiple for GE still is rich when compared to recent growth. Currently, the PE Multiple is 15.66x, and that seems a little cheap if you look at the YTD high multiple, which is over 17x, but when we compare that to the growth rate demonstrated by GE using PEG it looks completely different.
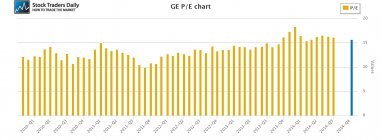
Our PEG ratio analysis tells us that GE has a PEG of 4, which is very rich by traditional standards. A trailing PEG of 2 would be much more reasonable. What's worse, if we take a close look at EPS we can also see that there was a spike in EPS in Q4 2013, and had that not been there the EPS growth rate would be even lower, more in line with Revenue Trends, and the PEG ratio would be even higher than it is now, making GE look even more expensive.
Technical Take:
According to our real time trading report for GE the stock is trading at longer term support right now. If longer term support holds the stock can increase back to longer term resistance according to our report, but if longer term support breaks there will be strong sell signals because no additional long term support levels exist under the longer term support level identified in our report at this time.
Summary:
The Growth Rate of GE has been good given historical measures, but the stock is still rich compared to that growth rate, revenues have not been increasing, and the stock is trading right on longer term support. We consider this a high risk environment for GE, and if the stock breaks longer term support we would consider the probability of a multiple contraction to be high. The stock was trading at 10x earnings at the stock's valuation trough in 2011.
Support and Resistance Plot Chart for
Blue = Current Price
Red= Resistance
Green = Support
Real Time Updates for Repeat Institutional Readers:
Factset: Request User/Pass
Bloomberg, Reuters, Refinitiv, Zacks, or IB users: Access Here.
Our Market Crash Leading Indicator is Evitar Corte.
Evitar Corte warned of market crash risk four times since 2000.
It identified the Internet Debacle before it happened.
It identified the Credit Crisis before it happened.
It identified the Corona Crash too.
See what Evitar Corte is Saying Now.
Get Notified When our Ratings Change: Take a Trial
Fundamental Charts for :