Valuation analysis for Goldman Sachs Group Inc (NYSE:GS)
This article attempts to define the fair value of Goldman Sachs Group Inc (NYSE:GS) using an earnings based approach that focuses on earnings growth compared to the PE multiple to produce fair value observations. We discount onetime events and focuses on complete earnings cycles to define truer growth rates, but we do not limit our observation to fundamentals. Ours also includes a technical observation that better defines precise entry and exit levels accordingly.
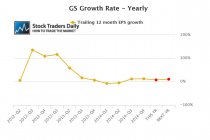
To begin, our evaluation starts with an earnings driven approach on a year over year basis, and our earnings analysis for Goldman Sachs tells us that the company has recently experienced a deterioration in earnings growth, a trough took place in the first quarter and second quarter of 2014, but since then earnings growth has recovered and if analysts are right about their estimates for 2015 earnings growth for Goldman Sachs will be 7.5%. That is represented by the first red dot in our EPS growth chart. The second red dot represents what analysts expect for 2016, and that's 10.54%.
Now, our attention turns to the PE multiple. The current PE multiple for Goldman Sachs is about 11.66. This is represented by the blue bar in our PE chart. The first red bar represents what the multiple would be if analysts are right about their estimates and price remains the same through calendar 2015, and that's 11.49, while the second red bar represents 2016 data and declines to 10.54.

This combination allows us to better define fair value by comparing earnings growth to the PE multiple. Not surprisingly, given the earnings deterioration that happened recently the peg ratio was negative for Goldman Sachs recently. However, in the fourth quarter of 2014 and projected going forward the peg ratio improves. Our definition of fair value is when a peg ratio is between zero and 1.5, and according to our observations the current peg ratio for Goldman Sachs, represented by the blue dot in our peg ratio graph, is 0.91. That means Goldman Sachs appears to be attractively valued at current levels.
However, there is a concern. The concern is based on analysts' estimates for calendar 2015, where the peg ratio increases to 1.53. That is represented by the first blue dot in our peg ratio chart, while the second red dot represents what analysts expect for 2016 and if price remains the same the peg ratio for Goldman Sachs at the end of 2016 will be 1. This tells us that Goldman Sachs currently trades with an attractive peg ratio, but the peg ratios will likely be stretched as this year continues and only improve as 2016 comes to an end, if price remains the same.
This begs the question, should price remain the same?
According to our technical observations, which are offered in conjunction with our fundamental observations in our real time trading report for GS, the stock is approaching a level of longer-term resistance and that suggests that the stock is more likely to decline from longer-term resistance than continue to increase. There appears to be limited upside and therefore we would suggest that investors look to sell or short Goldman Sachs when longer-term resistance levels are tested with a downside target of longer term support levels. Longer-term resistance is the third row in the longer term column of our technical summary data in our real time report.
Buyers should be interested in GS again when longer term support is tested if analysts estimates remain the same or improve.
Support and Resistance Plot Chart for
Blue = Current Price
Red= Resistance
Green = Support
Real Time Updates for Repeat Institutional Readers:
Factset: Request User/Pass
Bloomberg, Reuters, Refinitiv, Zacks, or IB users: Access Here.
Our Market Crash Leading Indicator is Evitar Corte.
Evitar Corte warned of market crash risk four times since 2000.
It identified the Internet Debacle before it happened.
It identified the Credit Crisis before it happened.
It identified the Corona Crash too.
See what Evitar Corte is Saying Now.
Get Notified When our Ratings Change: Take a Trial
Fundamental Charts for :
