 pool ads
Valuation analysis for Google Inc (NASDAQ:GOOG)
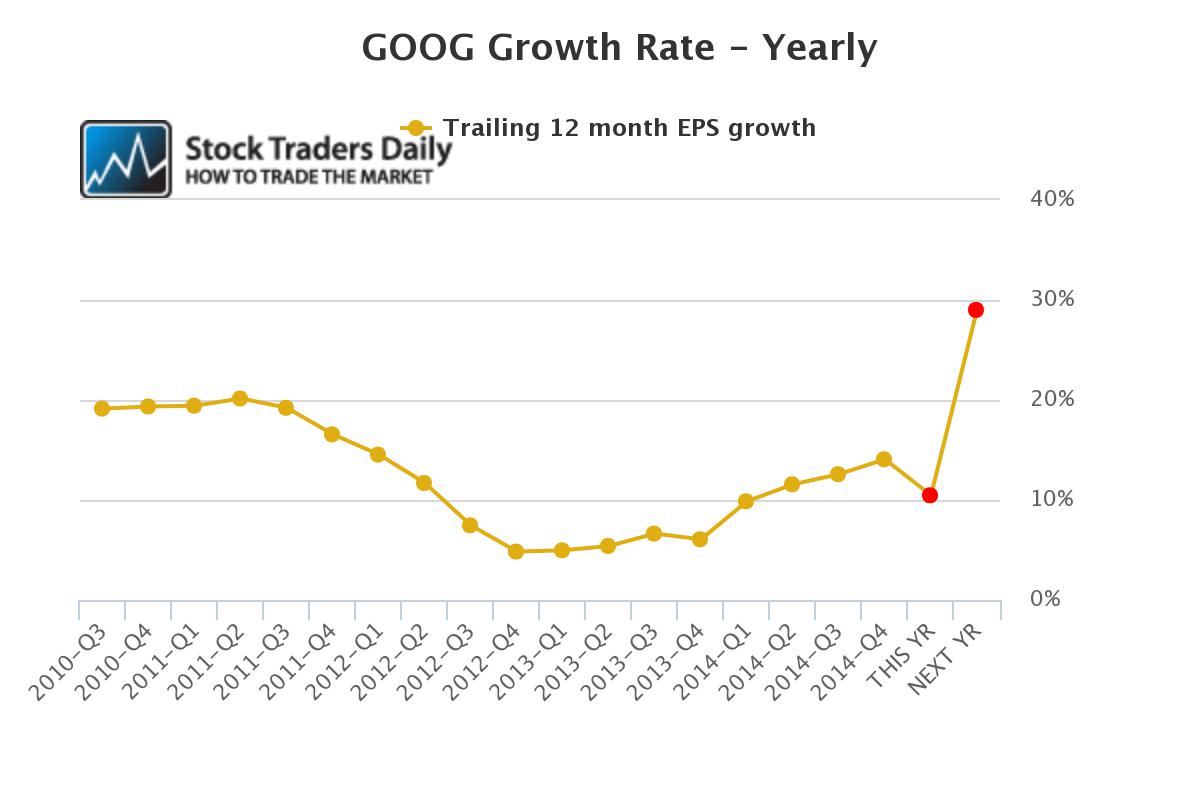
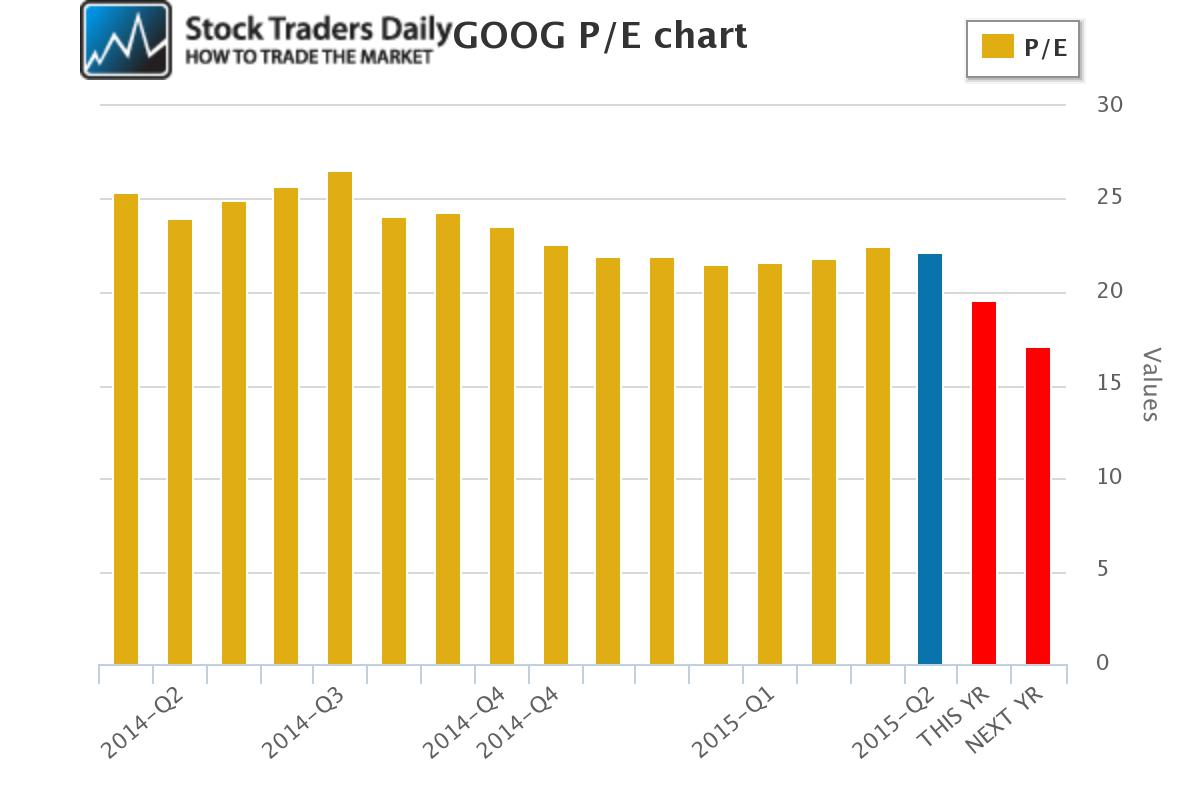
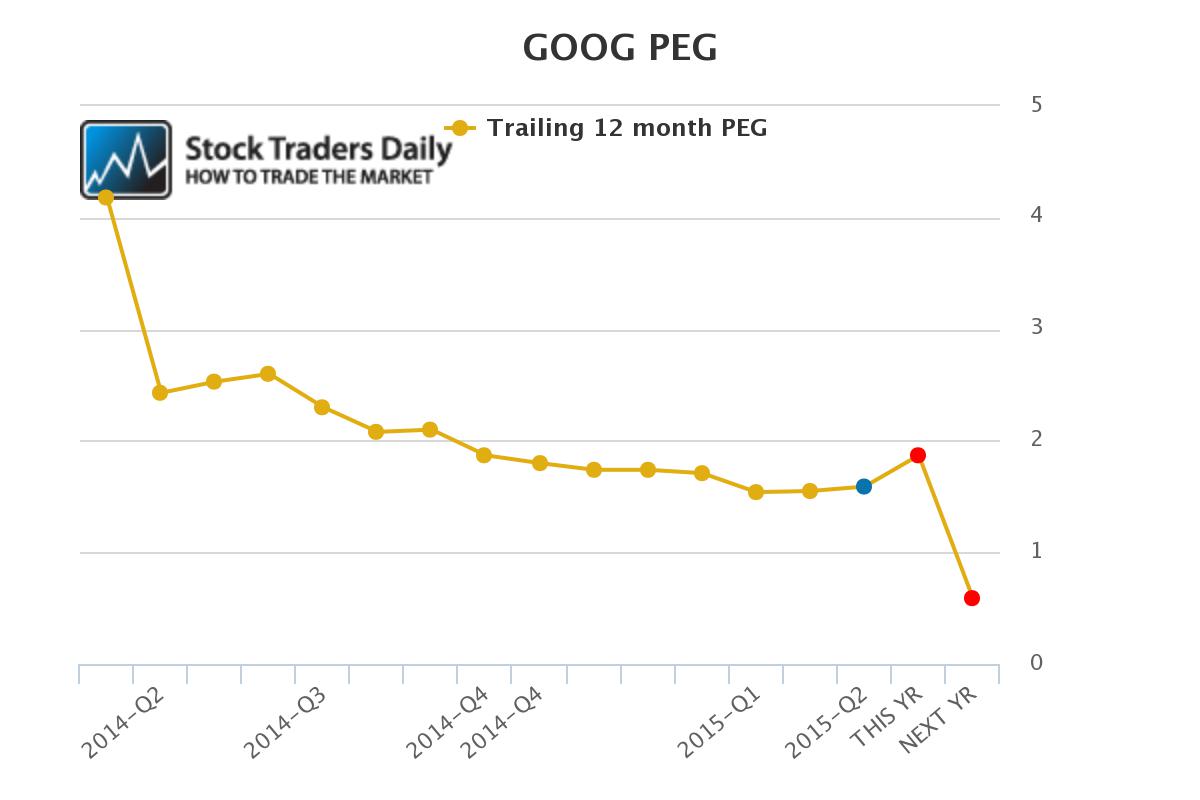
Stock Traders Daily has updated its valuation analysis for Google Inc (NASDAQ:GOOG) Take a close look at the forward PEG ratio for 2016 in the charts below. In addition, other relevant data is offered below. We have also provided technical indicators that suggest that GOOG is now close to our longer term resistance level.
Technical Summary:
| Term → | Near | Mid | Long |
| Bias | Strong | Neutral | Neutral |
| P1 | 524.92 | 515.85 | 479.7 |
| P2 | 535.41 | 549.5 | 526.99 |
| P3 | 542.11 | 582.57 | 572.11 |


Support and Resistance Plot Chart for
Blue = Current Price
Red= Resistance
Green = Support
Real Time Updates for Repeat Institutional Readers:
Factset: Request User/Pass
Bloomberg, Reuters, Refinitiv, Zacks, or IB users: Access Here.
Our Market Crash Leading Indicator is Evitar Corte.
Evitar Corte warned of market crash risk four times since 2000.
It identified the Internet Debacle before it happened.
It identified the Credit Crisis before it happened.
It identified the Corona Crash too.
See what Evitar Corte is Saying Now.
Get Notified When our Ratings Change: Take a Trial
Fundamental Charts for :