 pool ads
Valuation analysis for Intel Corporation (NASDAQ:INTC)
This is the thirteenth valuation report issued valuation report issued for the stock in the DJIA. When these public reports are disclosed they will combined to offer a one by one fair value analysis of the stocks in the DJIA. The data being used for these reports and a fair value analysis of the Markets have already been supplied to subscribers of Stock Traders Daily
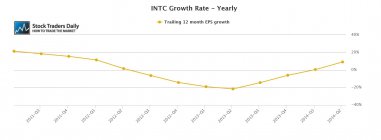
Intel Corporation (NASDAQ:INTC) has had a pretty tough go of it. Earnings and revenue growth have been virtually nonexistent, but there is a bright spot in the yearly earnings growth rate that we observe. The trailing 12 month yearly EPS growth rate for Intel has turned positive after slumping into negative territory recently. That is a good sign and a hopeful one for investors.
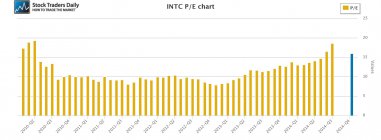
Interestingly, however, during this period of no growth that Intel has experienced over the past few years the stock has still increased measurably, so something seems askew. When looking closely at the stock we can see that the PE multiple increased aggressively between the first quarter of 2013 and now, moving from near 8x to near 18x before the recent pullback. That multiple expansion, without corresponding EPS growth, is exactly why Intel's stock price has increased.
The rationale for multiple expansion can either be placed on the expectation for future earnings growth, or on excess liquidity in the Financial System. In this particular case Intel is not expected to grow earnings at a rate that would support a multiple as high as the one levied on the stock at this time, so our conclusion is that the reason Intel's stock price increased was because there was excess liquidity in the Financial System chasing the Dow Jones industrial average stocks. This is a direct result of FOMC stimulus policy as investors poured money into ETFs that track the Dow Jones industrial average, placing a bid on stocks like Intel that have no growth and that are not expected to grow measurably.
Technical take:
According to our real time trading report for INTC, although Intel has clearly come down from its recent peak the stock has also broken below longer term support, and when longer term support levels break technical red flags surface. That is exactly what is happening now. Technically, Intel has broken longer term support and there are no additional longer term support levels under that longer term support level at this time. Intel is capable of falling aggressively as a result, so long as it remains under that former level of support, which has now been converted into resistance.
Summary:
Intel has not been growing, its price has been supported by FOMC policy because the stock price increased solely due to multiple expansion, and the stock just broke longer term support. Analysts are not expecting aggressive growth from Intel in the years ahead, and this combination suggests that the multiple expansion that drove the stock higher could be taken out and the stock can experience multiple contractions back down to where the PE was at the beginning of 2013. There are big red flags for Intel.
Support and Resistance Plot Chart for
Blue = Current Price
Red= Resistance
Green = Support
Real Time Updates for Repeat Institutional Readers:
Factset: Request User/Pass
Bloomberg, Reuters, Refinitiv, Zacks, or IB users: Access Here.
Our Market Crash Leading Indicator is Evitar Corte.
Evitar Corte warned of market crash risk four times since 2000.
It identified the Internet Debacle before it happened.
It identified the Credit Crisis before it happened.
It identified the Corona Crash too.
See what Evitar Corte is Saying Now.
Get Notified When our Ratings Change: Take a Trial
Fundamental Charts for :