 pool ads
Valuation analysis for Netflix, Inc. (NASDAQ:NFLX)
In conjunction with our fundamental observations below, our real time trading report for NFLX suggest that the stock probably has additional upside left before the tests of longer-term resistance levels. Once the stock tests longer-term resistance, however, sell signals and short signals will surface. If the stock tests of longer-term resistance on the heels of earnings we would be Sellers and short Sellers of the stock accordingly so long as resistance levels remain intact. Longer-term resistance is identified by the P-3 parameter in the longer-term column of our technical table for NFLX.
Netflix, Inc. (NASDAQ:NFLX) is scheduled to report earnings tomorrow, Wednesday, the 15th of April, and analysts are expecting the company to report EPS of $0.69 per share. In the second quarter analysts are expecting Netflix to report earnings of $0.95 per share, and each of those estimates are below the previous year's results. That is important to understand when evaluating Netflix on a fundamental basis.
Our observation focuses on earnings growth, and we use complete earnings cycles while excluding onetime events to better focus on true earnings growth.
When we conduct our analysis we do so on a quarterly basis and on a yearly basis because that helps reveal things that one or the other might not immediately disclose. Each one of these observations includes complete earnings cycles and excludes onetime events, but our quarterly EPS growth chart compares the past 12 months quarter over quarter while the yearly growth chart compares the past 12 months on a year over year basis.
When we look at the difference between the quarterly growth chart and the yearly growth chart for Netflix given the expectations not only for tomorrow's release, but for calendar 2015 and 2016 as well, we start to see something concerning. The concerns come from the quarterly growth rate.
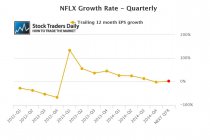
What we have found is that the quarterly growth rate often is a precursor to changes in the yearly growth rate chart, and if that is true the yearly growth rate for Netflix may begin to change quite a bit. In the quarterly growth rate chart we can see that quarterly growth for Netflix was -1.86% as of the fourth quarter of 2014, but that will improve if analysts are correct about their estimates tomorrow and the next quarter and the growth rate will increase to 2.44%.
The problem here is that Netflix, over the past two quarters, was not growing very much.
On a yearly basis, the comps from a year ago make the growth rates seem robust, but according to our quarterly growth rate chart earnings growth is much more difficult now that the easy comps that came in 2012 and 2013 are no longer factoring into our comparison.
Keep in mind, because we use complete earnings cycles and 12 months of past data to compare growth on a year over year basis, when we compare the first quarter of 2015 to the first quarter of 2014 the data for the first quarter of 2014 includes the easy comps from 2013. However, the data for the first quarter of 2015 does not, so the growth rate in our yearly chart looks impressive, but concerns exist because our quarterly growth rate chart does not include 2013 data, and soon our yearly growth rate chart won't either.
With PE multiples at extremely lofty levels, the lack of quarterly growth at Netflix is a concern. It presents serious valuation risk, and when we look at what analysts are expecting this quarter and next quarter and when we realize that those expectations are lower than the previous year's numbers that valuation risk gets even more serious.
Netflix, on a fundamental basis, is showing serious signs of concern because earnings growth is not currently warranting the high multiples, and the expectations analysts have for this quarter, next quarter, and calendar 2015 do not warrant them either. This opens the door to significant price fluctuations and any bit of negative news could hurt the stock seriously.
Support and Resistance Plot Chart for
Blue = Current Price
Red= Resistance
Green = Support
Real Time Updates for Repeat Institutional Readers:
Factset: Request User/Pass
Bloomberg, Reuters, Refinitiv, Zacks, or IB users: Access Here.
Our Market Crash Leading Indicator is Evitar Corte.
Evitar Corte warned of market crash risk four times since 2000.
It identified the Internet Debacle before it happened.
It identified the Credit Crisis before it happened.
It identified the Corona Crash too.
See what Evitar Corte is Saying Now.
Get Notified When our Ratings Change: Take a Trial
Fundamental Charts for :