 pool ads
Valuation analysis for Pfizer Inc. (NYSE:PFE)
This is the 21st public analysis geared towards identifying fair value in the Dow Jones industrial average. Stock Traders Daily has already provided this information to clients, fair value for the Dow Jones industrial average has already been identified, but as this series of public reports continues it will conclude with a fair value analysis of the Dow Jones industrial average so normal investors (non-subscribers) can identify the risk that might currently exist in their portfolio too.
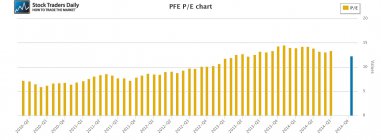
At first glance shares of Pfizer Inc. (NYSE:PFE) appear to be fairly valued with a peg ratio of 1.89. Recent trailing 12 month growth rates have been solid, 6.51% to be exact, so with a PE multiple slightly above 12 a first glance observation suggests that Pfizer is not trading out of line with its growth rate.
However, when we take a closer look we see something that is quite concerning. First, although earnings growth has been realized recently, earnings have not actually grown for years, but instead have fluctuated wildly, and there is no clear up trend to earnings growth as a result.
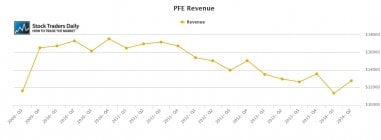
More concerning, at the same time EPS seemed to have been stabilized revenues have declined aggressively. When looking at the combination of earnings and revenue we can surmise that management to proper steps to stabilize earnings in the face of deteriorating revenue growth, and that suggests management is doing a good job, but that also suggests that a relationship exists at Pfizer at this time that puts that peg ratio valuation metrics into question. Quite simply, earnings cannot be expected to increase in the face of declining revenues for very long.
Technical take:
According to our real time trading report for Pfizer, shares are declining from tests of longer-term resistance and the stock is poised to test longer term support as a result. Our combined analysis tells us to expect the stock to decline further and it tells us to treat support as an inflection level when it is tested. If support remains intact we should expect the stock to increase back towards resistance, but if longer term support breaks there are no additional support levels under current market levels and breaks would be a major red flag.
Summary:
The relationship between revenue and earnings growth makes the peg ratio valuation metric unreliable and sheds doubt on the ability of the company's ability to grow. Analysts also expect no growth from the company, and if that's true that current multiple levied on shares of Pfizer seems rich compared to its historical multiple. Pfizer traded with a PE multiple closer to seven times earnings when the company was earning much more in revenue, and although the multiple has come Down from over 14 to just over 12, multiple contraction is still absolutely possible from here. As the stock is also declining from longer-term resistance towards longer term support we consider the fundamentals to support the technicals and suggest further deterioration from shares of Pfizer.
Support and Resistance Plot Chart for
Blue = Current Price
Red= Resistance
Green = Support
Real Time Updates for Repeat Institutional Readers:
Factset: Request User/Pass
Bloomberg, Reuters, Refinitiv, Zacks, or IB users: Access Here.
Our Market Crash Leading Indicator is Evitar Corte.
Evitar Corte warned of market crash risk four times since 2000.
It identified the Internet Debacle before it happened.
It identified the Credit Crisis before it happened.
It identified the Corona Crash too.
See what Evitar Corte is Saying Now.
Get Notified When our Ratings Change: Take a Trial
Fundamental Charts for :