Predictive AI
Adds Alpha, Reduces Beta, Controls Risk
Valuation analysis for Procter & Gamble Co (NYSE:PG)
Procter & Gamble Co (NYSE:PG) is a company that we all know, most of us use their products, and this integral component of the Dow Jones industrial average is considered a bellwether. The discussion below is not intended to suggest that Procter & Gamble is a bad company, this is not a comment about their products, but it is instead a close look at valuation in an effort to determine what the fair value of Procter &Gamble is given forward looking analysts' estimates.
My evaluation focuses on earnings and earnings growth in particular, with an emphasis on trailing 12 month earnings and trailing 12 month forward expectations compared year over year to define yearly earnings growth accordingly. This review will also entail PE multiples and forward looking peg ratios to reach our conclusion.
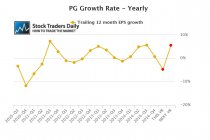
Since 2011 the yearly earnings growth for Procter & Gamble has oscillated between earnings growth of about 5% and contractions that pressed 2% respectively. We can clearly see this in the EPS growth chart for Procter & Gamble, and given the raw EPS chart that accompanies it that review is also substantiated to conclude that earnings growth has not been substantial.
More precisely, the recent earnings growth for Procter & Gamble is less than 1% and if analysts are correct about this coming year earnings growth will actually contract by 4.71% (below the recent troughs). Analysts do expect earnings growth to get back to near 5% by the time 2016 comes to an end, but immediately the next few quarters looked challenging at best.
Throughout this entire time, as earnings have been meager, the PE multiple for Procter & Gamble has increased steadily. Without corresponding earnings growth, or revenue growth for that matter, the PE multiple has increased from near 13 times earnings in 2010 to near 21 times earnings currently, and if analysts' estimates are correct and price remains the same that PE multiple will likely increase beyond 21 times earnings by the end of the year.
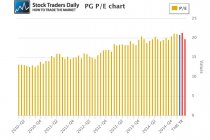
For a company that is not growing and expected to contract even more a PE multiple of 21 times earnings is rich, and that can be substantiated by looking at our peg ratio chart for Procter & Gamble.
In our opinion the current peg ratio of 28 is less important than the future peg ratios associated with forward looking analyst expectations. For this year that peg ratio is expected to be -4.54, but if analysts are right and earnings growth comes back by the end of 2016 the peg ratio for Procter & Gamble will increase to 3.54.
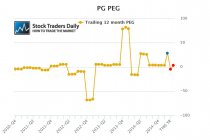
However, we consider fair value on a peg ratio basis to be between 0 and 2, but even after the end of 2016, if analysts are correct, Procter & Gamble will be trading with a peg ratio well over 3.
Technical take:
According to our real time trading report for Procter & Gamble the stock is breaking down below longer term support and if the stock remains under this converted resistance level, the former support level, we would expect the stock to continue to decline accordingly. Our bearish observation would only change if Procter & Gamble reverses back above its now converted resistance line.
Summary:
Procter & Gamble looks rich. Not only does it look rich today, but even if analysts are correct about their 2016 estimates the stock will even look rich then. In our opinion the multiple expansion that has taken place at Procter & Gamble was not supported by earnings growth, it was not supported by revenue growth, and with the forward looking deterioration this year the risk of a multiple contraction in shares of Procter & Gamble appear extremely high.
Disclaimer: Stock Traders Daily provides trading strategies, which by definition incorporate risk controls, and it has only engaged in buy and hold strategies twice since the turn of the century. The first was in October of 2002, and those buy and hold strategies lasted until 2006, and the second was in February of 2009, and those buy and hold strategies lasted until the end of 2010. Every point in between Stock Traders Daily has been providing risk controlled strategies, market based strategies, and strategies for approximately 3000 individual stocks, which are unbiased and which incorporate the notion that short term gains lead to long term success. There is a time and a place for buy and hold strategies and this is neither the time nor the place for that approach in our opinion. Risk controls are essential.
⚠Triggers may have already come
Support and Resistance Plot Chart for
Blue = Current Price
Red= Resistance
Green = Support
Real Time Updates for Repeat Institutional Readers:
Factset: Request User/Pass
Bloomberg, Reuters, Refinitiv, Zacks, or IB users: Access Here.
Our Market Crash Leading Indicator is Evitar Corte.
Evitar Corte warned of market crash risk four times since 2000.
It identified the Internet Debacle before it happened.
It identified the Credit Crisis before it happened.
It identified the Corona Crash too.
See what Evitar Corte is Saying Now.
Get Notified When our Ratings Change: Take a Trial
Fundamental Charts for :