 pool ads
Valuation analysis for The Procter & Gamble Company (NYSE:PG)
Given the recent market weakness it is important to identify the fair value of the Dow Jones industrial average (how far can it fall), so in an effort to make that more obvious to individual investors Stock Traders Daily has published a series of reports identifying the fair value of each member of the Dow Jones industrial average, one by one. This is the 22nd report in that series, and although the fair valuation analysis has already been provided to clients of Stock Traders Daily, when this series is finished the fair valuation will be made public as well so that individual investors who are not subscribers to Stock Traders Daily can understand the risks that exist in their portfolios as well.
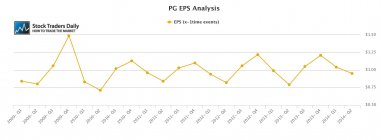
When we think of The Procter & Gamble Company (NYSE:PG) we do not think of a company that grows at a fast rate. Instead, we think of a slow but steady company that we can rely on to survive through thick and thin. This is considered a conservative stock by most traditional analysts, most of them do not expect aggressive growth from the stock either, and when we look at earnings and revenue trends we can see that those trends are relatively neutral. This supports the general thesis.
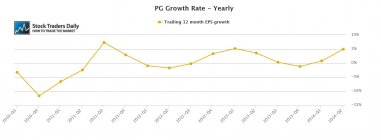
In addition, and quite interestingly, when we look at trailing 12 month EPS growth rates and not just at the raw numbers we can see that the EPS growth rates for Procter & Gamble have oscillated between 0% and 5% over the past handful of years. Given this consistency it is reasonable for us to suggest that the average growth rate for PG over the past handful of years has been about 2.5% on average.
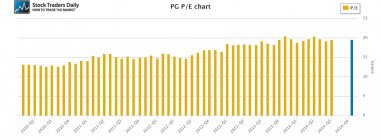
This is not surprising given the slow but steady expectation most investors have for Procter & Gamble, but what is surprising is that shares of this stock have increased aggressively and the stock is currently trading with a PE multiple of 20 times earnings. Analysts do expect earnings growth going forward, but based on what they seem to expect it is not much different than what PG has demonstrated in the recent past. Therefore, if the company has been growing at about the 2.5% rate on average and analysts expect something in line with past performance going forward, the 20 times earnings multiple makes the stock look very rich.
Technical take:
According to our real time trading report for Procter & Gamble the stock is currently in the middle of a longer term trading channel but it has not successfully tested support or resistance recently. Instead, the stock appears to be floundering in the middle of its channel and not until it moves one way or the other would we expect a test of support or resistance to occur. When a test does occur action should be taken based upon the test, regardless of which way it moves.
Summary:
The slow growth experienced by Procter & Gamble is in line with expectations, in line with historical measures, but not quite in line with the multiple levied on the stock at this time. For Procter & Gamble to trade at 20 times earnings the EPS growth rate for Procter & Gamble would need to accelerate meaningfully. That is not something that most analysts are expecting. Instead, they expect a slow but steady continuation, and although slow but steady, consistent, and reliable are all attractive qualities in a market that poses risk like this one, when the stock trades at a multiple as lofty as Procter & Gamble without corresponding growth rates the risks in this otherwise conservative company accelerate for investors in the stock (and most don't realize it). As a result, we are not comfortable with investments and Procter & Gamble given that high multiple.
Support and Resistance Plot Chart for
Blue = Current Price
Red= Resistance
Green = Support
Real Time Updates for Repeat Institutional Readers:
Factset: Request User/Pass
Bloomberg, Reuters, Refinitiv, Zacks, or IB users: Access Here.
Our Market Crash Leading Indicator is Evitar Corte.
Evitar Corte warned of market crash risk four times since 2000.
It identified the Internet Debacle before it happened.
It identified the Credit Crisis before it happened.
It identified the Corona Crash too.
See what Evitar Corte is Saying Now.
Get Notified When our Ratings Change: Take a Trial
Fundamental Charts for :