Valuation analysis for Walt Disney Co (NYSE:DIS)
When stocks are on a roll it is sometimes hard to hold back, some investors love the momentum, but value oriented investors should avoid the temptation that often accompanies stocks that are in the news, relatively hot, and experiencing momentum driven moves because those stocks often push the boundaries of valuation beyond what value oriented investors would consider ideal.
This article identifies the fair value of Walt Disney Co (NYSE:DIS) using valuation metrics that are tied directly to earnings growth. We consider current and future earnings expectations in conjunction with the PE multiple to determine fair value on a peg ratio basis. Our earnings driven observations entail complete earnings cycles to remove seasonal anomalies, we remove onetime events to identify truer growth rates, and we do not look ahead further than two years because we do not trust analyst expectations beyond that time frame.
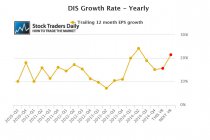
Our observations of earnings growth for Disney first show us that growth rates are declining from their recent peak, which was in the second quarter of 2014, but as of the most recent earnings release the growth rate at Disney was still healthy at 15.19%. In addition, if analysts are right about their earnings expectations for calendar 2015 earnings growth will increase to 15.71%, and accelerate further to 21.54% if they are right about calendar 2016. These forward looking earnings estimates are represented by the first and second red dots in our earnings growth chart.

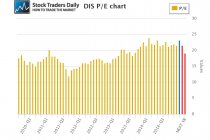
This brings our attention to the PE multiple that exists today and that would exist if analysts are right about their estimates. The current multiple levied on shares of Disney at this time is 23.17, which looks relatively rich to the naked eye. That is represented by the blue bar, while the first red bar represents what the multiple will be if analysts are right about their estimates for calendar 2015 and price remains the same. That value is 21.52, but it declines to 19.07, the second red bar, if analysts are right about their estimates for 2016 as well. This tells us that the PE improves slightly in the years ahead, and that's generally positive.

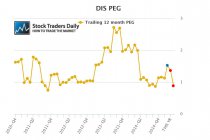
With a closer eye, however, we can consider both the earnings growth rate and the PE multiple in a peg ratio format to define fair value. Our guideline for peg ratios suggest that fair value on a peg ratio basis is typically between zero and 1.5, and Disney currently trades with a peg ratio of 1.53. This is represented by the blue dot in our peg ratio chart. It also suggests that Disney is trading with the current valuation but that is somewhat stretched, or at least at the upper end of our boundary.

Looking ahead, however, if analysts are right about their earnings expectations for calendar 2015 and price remains the same the peg ratio will decline to 1.37 at the end of 2015, and decline to 0.89 by the end of 2016 if analysts are right about that year as well. This suggests that valuation improves over time if analysts are right about their estimates.
So should price remain the same?
At first glance, shares of Disney are trading at the high end of our valuation observations, but clearly valuation levels improve over time and that means that the share price may very well increase from current levels over time as well as valuation levels become better and better.
The problem is that there is two years between now and when valuation levels look extremely attractive again according to analysts' estimates. At current levels, with a peg ratio of 1.53, we would not consider Disney to look extremely attractive, but it is at the high end of its valuation range, and as a result we would also consider it to run the risk of declining before continuing to move higher.
Our combined analysis for Disney tells us that if the stock begins to decline modestly from current levels it will run the risk of declining by 10- 15% before it stabilizes, and if that happens and analysts' estimates remain the same we would consider that to be a much more ideal time for value oriented investors to consider investing in Disney. At current levels we would consider Disney less than ideal for value oriented investors who are looking to put new money to work.
Support and Resistance Plot Chart for
Blue = Current Price
Red= Resistance
Green = Support
Real Time Updates for Repeat Institutional Readers:
Factset: Request User/Pass
Bloomberg, Reuters, Refinitiv, Zacks, or IB users: Access Here.
Our Market Crash Leading Indicator is Evitar Corte.
Evitar Corte warned of market crash risk four times since 2000.
It identified the Internet Debacle before it happened.
It identified the Credit Crisis before it happened.
It identified the Corona Crash too.
See what Evitar Corte is Saying Now.
Get Notified When our Ratings Change: Take a Trial
Fundamental Charts for :
