 pool ads
Ahead of Earnings: PCLN, NVDA
With earnings coming on Thursday, Priceline (NASDAQ: PCLN) and Nvidia (NASDAQ:NVDA) are in focus. The observations below help investors anticipate results from these companies before the earnings are released, but the share-price action after earnings are released is not always the same as the meet-or-beat comparisons that the Street often considers a gauge of success. A more accurate assessment of price action is better covered in the real time trading reports for these companies, which are also provided by Stock Traders Daily.
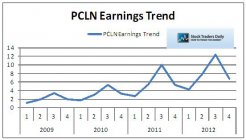
First, the earnings trend of Priceline is very cyclical. Every year earnings have peaked in the third quarter, and bottomed in the first quarter. Therefore, our observations tell us to expect earnings to be lower in this reporting cycle than it was last time, but if history repeats itself the following two quarters are likely to be quite strong. The guidance for Priceline will be key, because analysts will want to know what the company expects in the following two quarters, which is where the company shines, and they will reasonably discount the results from this quarter, which is the worst on average annually for the company. Therefore, forward expectations are incredibly important this time. Analysts will need to see forward guidance for Q2 well above $7.85.
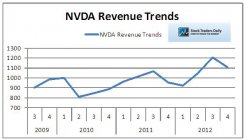
Next, beginning n the first quarter of 2012 Nvidia started to make progress again, after experiencing quite a terrible previous few years. Unfortunately the company has a history of experiencing a series of quarters of revenue declines in a row, this has happened a few times already, and the third quarter of 2012 seems to be a peak in revenues as well. The fourth quarter results were already lower than the third quarter, and that means this quarter’s results could easily be below the previous quarter. Based on our observations of historical patterns for earnings and revenue Nvidia is likely to experience additional contraction this quarter, and it could experience flat-line revenue results for the year. The patterns here are not cyclical by nature, but they are sporadic, and that is a concern.
Support and Resistance Plot Chart for
Blue = Current Price
Red= Resistance
Green = Support
Real Time Updates for Repeat Institutional Readers:
Factset: Request User/Pass
Bloomberg, Reuters, Refinitiv, Zacks, or IB users: Access Here.
Our Market Crash Leading Indicator is Evitar Corte.
Evitar Corte warned of market crash risk four times since 2000.
It identified the Internet Debacle before it happened.
It identified the Credit Crisis before it happened.
It identified the Corona Crash too.
See what Evitar Corte is Saying Now.
Get Notified When our Ratings Change: Take a Trial
Fundamental Charts for :