Proprietary Signals for MSTU:CA
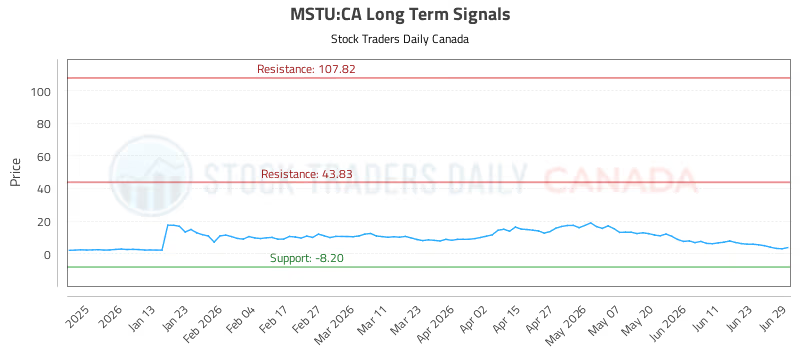
Chart for LFG Daily (2X) MSTR Long ETF (MSTU:CA)
Blue = Current Price
Red = Resistance
Green = Support
Trading Plans Summary
Side-by-Side Comparison| Trading Plan | Bias | Action / Trigger | Profit Target | Stop Loss | Execution Rule |
|---|---|---|---|---|---|
| Risk Hedging Strategy Tactical / Swing | SHORT / HEDGE | $43.83 | N/A | $44.05 (+0.50%) | Enter short near the entry level; cover at the target; stop loss if resistance breaks. |
Risk Hedging StrategySHORT / HEDGE
Tactical / SwingReward/Risk —
- Step 1 · EnterSell short near$43.83
- Step 2 · Take profitBuy back (cover) atN/A
- Step 3 · ProtectExit if price rises above$44.05+0.50%
PlanShort MSTU:CA near $43.83 · Target N/A · Stop $44.05
| Order Level | Price | Distance from Trigger |
|---|---|---|
| Stop Loss (exit if above) | $44.05 | +0.50% |
| Trigger (short below) | $43.83 | — |
| Target (cover at) | N/A | — |
Entry$43.83
TargetN/A
Stop Loss$44.05
Multi-Timeframe Signal AnalysisSTRONG BIAS
| TIME HORIZON | SIGNAL STRENGTH |
|---|---|
| Near-term | Strong |
| Mid-term | Strong |
| Long-term | Weak |
Check the time stamp on this data. Updated Proprietary Signals for LFG Daily (2X) MSTR Long ETF (MSTU:CA) available here (MSTU:CA stock signals).
Triggers may have already come
Get Real Time Triggers Here.Recent Articles on LFG Daily (2X) MSTR Long ETF (MSTU:CA) 133 articles
- (MSTU) Stock Trading Blueprint October 25, 2026, 05:07 AM
- (MSTU) Market Insights and Trading Signals October 22, 2026, 05:33 AM
- (MSTU) Stock Analysis and Trading Signals October 19, 2026, 07:02 AM
- (MSTU) Stock Evaluation Report October 16, 2026, 09:05 AM
- (MSTU) Trading Report October 13, 2026, 10:45 AM
- (MSTU) Investment Report October 10, 2026, 12:32 PM
- (MSTU) Financial Trading Report October 07, 2026, 02:19 PM
- Objective long/short (MSTU) Report October 04, 2026, 03:46 PM
- (MSTU) Dynamic Trading Report October 01, 2026, 05:31 PM
- (MSTU) Investment Analysis September 28, 2026, 07:17 PM
- Learn to Evaluate (MSTU) using the Charts September 19, 2026, 12:58 PM
- (MSTU) Long Term Investment Analysis September 16, 2026, 02:26 PM
- (MSTU) Investment Report September 13, 2026, 03:51 PM
- Trend Tracker for (MSTU) September 10, 2026, 04:25 PM
- (MSTU) Pivots Trading Plans and Risk Controls September 07, 2026, 12:32 PM
- Learn to Evaluate (MSTU) using the Charts September 04, 2026, 10:26 AM
- When the Price of (MSTU) Talks, People Listen September 01, 2026, 11:00 AM
- (MSTU) On The My Stocks Page August 29, 2026, 11:18 AM
- (MSTU) Market Dynamics and Trading Signals August 20, 2026, 07:18 PM
- When the Price of (MSTU) Talks, People Listen August 17, 2026, 08:47 PM
- (MSTU) Strategic Investment Report August 14, 2026, 09:21 PM
- (MSTU) Technical Pivots with Risk Controls August 11, 2026, 10:51 AM
- (MSTU) Advanced Equity Analysis August 08, 2026, 06:42 AM
- (MSTU) Investment Performance Report August 05, 2026, 06:05 AM
- (MSTU) Equity Market Report August 02, 2026, 05:48 AM
- (MSTU) Technical Analysis and Trading Signals July 30, 2026, 03:11 AM
- (MSTU) Trading Strategy and Analysis July 27, 2026, 03:23 AM
- (MSTU) Comprehensive Trading Strategy Report July 24, 2026, 04:34 AM
- (MSTU) Technical Pivots with Risk Controls July 21, 2026, 05:40 AM
- (MSTU) Risk-Controlled Trading Report July 18, 2026, 07:09 AM
- How To Trade (MSTU) July 15, 2026, 08:59 AM
- (MSTU) Investment Analysis and Advice July 12, 2026, 10:48 AM
- How the (MSTU) price action is used to our Advantage July 09, 2026, 08:53 AM
- How To Trade (MSTU) July 06, 2026, 01:44 AM
- (MSTU) Market Performance Analysis July 02, 2026, 11:26 PM
- (MSTU) Investment Strategy and Analysis June 29, 2026, 11:35 PM
- (MSTU) Market Insights and Trading Signals June 27, 2026, 12:58 AM
- (MSTU) Stock Evaluation Report June 24, 2026, 01:32 AM
- (MSTU) Stock Evaluation Report June 21, 2026, 03:07 AM
- (MSTU) Investment Analysis and Advice June 18, 2026, 06:12 AM
- (MSTU) Trading Advice June 15, 2026, 08:54 AM
- (MSTU) Stock Analysis and Trading Signals June 12, 2026, 11:46 AM
- (MSTU) Investment Analysis June 09, 2026, 02:44 PM
- (MSTU) Equity Market Report June 06, 2026, 05:38 PM
- (MSTU) Trading Performance and Risk Management June 03, 2026, 06:01 PM
- (MSTU) Strategic Equity Report May 31, 2026, 08:17 PM
- (MSTU) Technical Patterns and Signals May 28, 2026, 11:23 PM
- (MSTU) Strategic Market Analysis May 26, 2026, 02:33 AM
- Trend Tracker for (MSTU) May 23, 2026, 05:42 AM
- (MSTU) Strategic Investment Report May 20, 2026, 08:54 AM
- Trend Tracker for (MSTU) May 17, 2026, 12:18 PM
- (MSTU) Investment Analysis May 14, 2026, 03:41 PM
- (MSTU) Market Dynamics and Trading Signals May 11, 2026, 07:07 PM
- Where are the Opportunities in (MSTU) May 08, 2026, 10:44 PM
- (MSTU) Investment Report May 06, 2026, 02:14 AM
- (MSTU) Investment Strategy and Analysis May 03, 2026, 06:15 AM
- (MSTU) Advanced Trading Insights April 30, 2026, 09:55 AM
- (MSTU) Trading Signals April 27, 2026, 01:36 PM
- (MSTU) Investment Analysis April 24, 2026, 05:19 PM
- When the Price of (MSTU) Talks, People Listen April 21, 2026, 09:02 PM
- Where are the Opportunities in (MSTU) April 19, 2026, 12:44 AM
- (MSTU) Market Insights and Trading Signals April 16, 2026, 04:27 AM
- Long Term Trading Analysis for (MSTU) April 13, 2026, 08:08 AM
- (MSTU) Technical Pivots with Risk Controls April 10, 2026, 11:50 AM
- (MSTU) Equity Trading Insights April 07, 2026, 03:32 PM
- (MSTU) Advanced Trading Insights April 04, 2026, 07:15 PM
- (MSTU) Advanced Trading Insights April 01, 2026, 10:57 PM
- (MSTU) Advanced Trading Insights March 30, 2026, 02:33 AM
- (MSTU) Market Performance Analysis March 27, 2026, 06:09 AM
- (MSTU) Stock Market Analysis March 24, 2026, 10:05 AM
- (MSTU) Strategic Market Analysis March 21, 2026, 01:42 PM
- (MSTU) Investment Strategy and Analysis March 18, 2026, 05:20 PM
- (MSTU) Market Insights and Trading Signals March 15, 2026, 09:16 PM
- (MSTU) Market Performance Analysis March 13, 2026, 12:58 AM
- (MSTU) Technical Data March 10, 2026, 04:57 AM
- (MSTU) Pivots Trading Plans and Risk Controls March 07, 2026, 08:34 AM
- (MSTU) Comprehensive Trading Strategy Report March 04, 2026, 01:06 PM
- (MSTU) Strategic Investment Report March 01, 2026, 04:04 PM
- (MSTU) Equity Trading Insights February 26, 2026, 07:20 PM
- (MSTU) Market Dynamics and Trading Signals February 23, 2026, 10:36 PM
- (MSTU) Technical Data February 21, 2026, 02:15 AM
- (MSTU) Investment Analysis February 18, 2026, 05:42 AM
- (MSTU) Dynamic Trading Report February 15, 2026, 08:59 AM
- (MSTU) Investment Strategy and Analysis February 12, 2026, 12:15 PM
- Long Term Trading Analysis for (MSTU) February 09, 2026, 03:35 PM
- (MSTU) Trading Advice February 06, 2026, 06:52 PM
- (MSTU) Proactive Strategies February 03, 2026, 10:09 PM
- (MSTU) Pivots Trading Plans and Risk Controls February 01, 2026, 01:26 AM
- (MSTU) Daily Stock Insights January 29, 2026, 04:25 AM
- (MSTU) Optimized Trading Opportunities January 26, 2026, 06:50 AM
- (MSTU) Technical Analysis and Trading Signals January 23, 2026, 09:28 AM
- (MSTU) Investment Analysis January 20, 2026, 12:11 PM
- Trend Tracker for (MSTU) January 17, 2026, 02:51 PM
- (MSTU) Market Insights and Trading Signals January 14, 2026, 05:27 PM
- (MSTU) Equity Market Report January 11, 2026, 08:02 PM
- (MSTU) Strategic Equity Report January 08, 2026, 10:51 PM
- (MSTU) Financial Trading Report January 06, 2026, 01:39 AM
- (MSTU) Trading Performance and Risk Management January 03, 2026, 04:29 AM
- Trend Tracker for (MSTU) December 31, 2025, 06:59 AM
- (MSTU) Investment Performance Report December 28, 2025, 09:28 AM
- (MSTU) Pivots Trading Plans and Risk Controls December 25, 2025, 12:00 PM
- Trend Tracker for (MSTU) December 22, 2025, 02:37 PM
- When the Price of (MSTU) Talks, People Listen December 19, 2025, 05:07 PM
- (MSTU) Risk-Controlled Trading Report December 16, 2025, 07:45 PM
- (MSTU) Equity Trading Insights December 13, 2025, 10:15 PM
- (MSTU) Trading Performance and Risk Management December 11, 2025, 12:49 AM
- (MSTU) Trading Report December 08, 2025, 03:33 AM
- When (MSTU) Moves Investors should Listen December 05, 2025, 06:23 AM
- (MSTU) Dynamic Trading Report December 02, 2025, 09:19 AM
- (MSTU) Strategic Market Analysis November 29, 2025, 12:11 PM
- (MSTU) Trading Signals November 26, 2025, 02:52 PM
- (MSTU) Advanced Trading Insights November 23, 2025, 05:31 PM
- (MSTU) Trading Strategy and Analysis November 20, 2025, 08:08 PM
- (MSTU) Stock Market Analysis November 17, 2025, 10:51 PM
- (MSTU) Investment Report November 15, 2025, 01:28 AM
- (MSTU) Advanced Trading Insights November 12, 2025, 04:06 AM
- How To Trade (MSTU) November 09, 2025, 06:40 AM
- (MSTU) Trading Report November 06, 2025, 09:18 AM
- (MSTU) Market Dynamics and Trading Signals November 03, 2025, 12:40 PM
- (MSTU) Technical Data October 31, 2025, 03:33 PM
- (MSTU) Long Term Investment Analysis October 28, 2025, 06:08 PM
- (MSTU) Trading Report October 25, 2025, 08:44 PM
- (MSTU) Dynamic Trading Report October 22, 2025, 11:22 PM
- Long Term Trading Analysis for (MSTU) October 20, 2025, 02:52 AM
- Objective long/short (MSTU) Report October 17, 2025, 05:31 AM
- Learn to Evaluate (MSTU) using the Charts October 14, 2025, 09:06 AM
- (MSTU) On The My Stocks Page October 11, 2025, 01:05 PM
- (MSTU) Market Performance Analysis October 08, 2025, 07:06 PM
- (MSTU) Risk-Controlled Trading Report October 05, 2025, 10:41 PM
- (MSTU) Trading Strategy and Analysis October 03, 2025, 01:52 AM
- (MSTU) Trading Strategy and Analysis September 30, 2025, 05:03 AM
- (MSTU) Investment Strategy and Analysis September 27, 2025, 08:12 AM
- (MSTU) Stock Trading Blueprint September 24, 2025, 11:29 AM