Proprietary Signals for SAU:CA
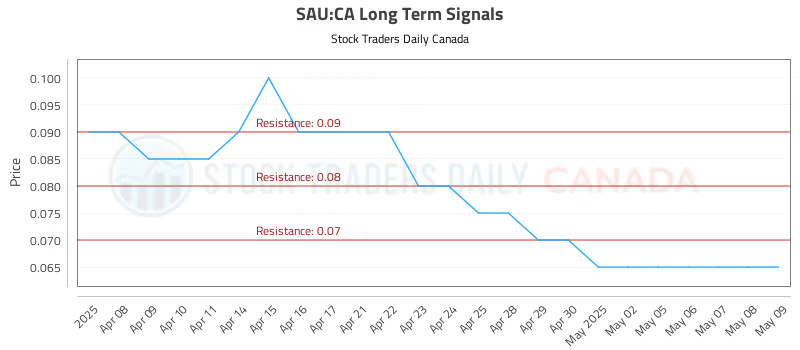
Chart for St. Augustine Gold and Copper Limited (SAU:CA)
Blue = Current Price
Red = Resistance
Green = Support
Risk Hedging StrategySHORT
Entry$0.07
TargetN/A
Stop Loss$0.07
Multi-Timeframe Signal AnalysisSTRONG BIAS
| TIME HORIZON | SIGNAL STRENGTH |
|---|---|
| Near-term | Strong |
| Mid-term | Strong |
| Long-term | Neutral |
Check the time stamp on this data. Updated Proprietary Signals for St. Augustine Gold and Copper Limited (SAU:CA) available here (SAU:CA stock signals).
Triggers may have already come
Get Real Time Triggers Here.Recent Articles on St. Augustine Gold and Copper Limited (SAU:CA) 12 articles
- (SAU) Stock Evaluation Report May 09, 2025, 01:41 AM
- (SAU) Equity Trading Insights May 06, 2025, 08:45 AM
- (SAU) Comprehensive Trading Strategy Report May 03, 2025, 03:34 PM
- (SAU) Technical Data April 30, 2025, 10:23 PM
- (SAU) Technical Pivots with Risk Controls April 28, 2025, 05:11 AM
- (SAU) Investment Analysis and Advice April 25, 2025, 12:03 PM
- (SAU) Equity Market Report April 22, 2025, 06:55 PM
- (SAU) Trading Signals April 20, 2025, 01:48 AM
- (SAU) Trading Signals April 17, 2025, 08:35 AM
- (SAU) Market Insights and Trading Signals April 14, 2025, 03:42 PM
- (SAU) Stock Analysis and Trading Signals April 11, 2025, 11:41 PM
- (SAU) Risk-Controlled Trading Report April 09, 2025, 04:08 AM