 pool ads
Allegheny Technologies $ATI Trading Report
The Allegheny Technologies (NYSE: ATI) update and the technical summary table below can help you manage risk and optimize returns. We have day, swing, and longer-term trading plans for ATI, and 1300 other stocks too, updated in real time for our trial subscribers. The data below is a snapshot, but updates are available now.
Technical Summary
| Term → | Near | Mid | Long |
|---|---|---|---|
| Rating | Weak | Strong | Weak |
| P1 | 0 | 0 | 16.32 |
| P2 | 19.12 | 19.50 | 18.78 |
| P3 | 19.90 | 20.32 | 21.20 |
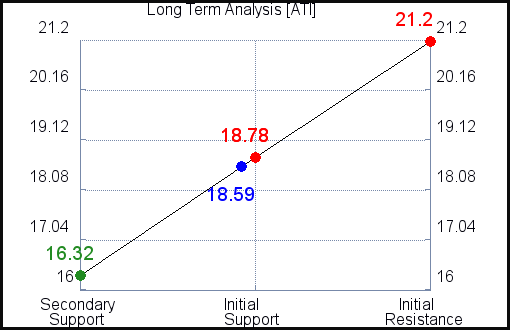
Support and Resistance Plot Chart for ATI
Long Term Trading Plans for ATI
February 26, 2020, 12:30 am ET
The Technical Summary and Trading Plans for ATI help you determine where to buy, sell, and set risk controls. The data is best used in conjunction with our Market Analysis and Stock Correlation Filters too, because those help us go with the flow of the market as well. Going with the flow is extremely important, so review our Market Analysis with this ATI Report.
ATI - (Long) Support Plan
The technical summary data tells us to buy ATI near 16.32 with an upside target of 18.78. This data also tells us to set a stop loss @ 16.06 to protect against excessive loss in case the stock begins to move against the trade. 16.32 is the first level of support below 18.59 , and by rule, any test of support is a buy signal. In this case, support 16.32 would be being tested, so a buy signal would exist.
ATI - (Short) Resistance Plan
The technical summary data is suggesting a short of ATI as it gets near 18.78 with a downside target of 16.32. We should have a stop loss in place at 19.04 though. 18.78 is the first level of resistance above 18.59, and by rule, any test of resistance is a short signal. In this case, if resistance 18.78 is being tested, so a short signal would exist.


