Predictive AI
Adds Alpha, Reduces Beta, Controls Risk
Our Fibonacci Calculator is Working: $SDS $SSO $QID $QLD $DDM $DXD
Why we need to pay attention to Fibonacci
Fibonacci is a Timing Tool and Our Calculator, which adapts Fibonacci Growth Rates to stock market cycles, has been highly accurate. Investors should be using this to find opportunity and control risk.
Here is Accuracy of our Calculator (past 18 months):
- Highly accurate during Pandemic – see chart
- 800 SPX points during Aug-Sept 2019 – see video
- The Best Trading Call in History: Dec 26, 2018 – see chart + video
Our Fibonacci Calculations have been highly actionable during this pandemic, like it was during other volatile times. Most recently, our Calculator provided huge results during the emotional Aug-September 2019 market, and the even more emotional December 2018 Market. Last week’s pandemic decline is equally as emotional as those, and again Fibonacci is working.
How can Fibonacci work during declines?
Our Fibonacci Calculator is based on NATURAL growth rates, of which emotions are an important variable; emotions are natural. That means our Fibonacci Calculator has a unique ability to identify opportunities when markets become volatile like this because emotions become elevated.
Our Fibonacci Calculator Identifies support and resistance
Included in this report:
- What Fibonacci says right now.
- Evidence and Details of the Accuracy.
- Charts and Videos describe how to use it.
- An opportunity to use our Fibonacci Calculator.
- 1. The Best Trading Call in History:
This is the best way to differentiate our Fibonacci Calculator from others.
Start by evaluating my claim to have had the best trading call in history. The DOW had its best 1-day point gain ever the day our 12.26.18 Fibonacci Signal was officially announced to the public, but the trigger point was available to paying subscribers days in advance. The signal was announced officially in pre-market on Dec. 26, 2018 and the video evidence we provide below was published when the market was down in early trading that day, so this trigger was announced right before the market turned.
On Dec. 26, 2018 the Market was down before it turned higher, and then had its best 1-day point gain ever, so if the magnitude and timing of a call means anything to the definition of the best trading call in history, then this is the best call I have ever seen (I happen to have made it too). Also, it was market based, not based on some option or futures bet. The call was HUGE!
Graphical Evidence below:
In the chart below you will see where the December 2018 Fibonacci Cycle began, and where it ended. The Yellow nose in the middle of the chart is the Dec. 26, 2018 Fibonacci Trigger. There was a sharp recovery thereafter, but the Fibonacci cycle had started well before that.

The Video Evidence that supports this chart does NOT make the claim to be the best trading call in history. The Video was published BEFORE the market turned, so the tone is not what you might expect from a video that supports such a big claim.
Instead, this video is matter of fact and rules based, but if you look at the levels of the market in the graphs seen in the video you will see that this call came before the 1000 point market move.
Video Evidence:
- Open the Video
- Look at the Market Levels
- Compare that to where the Market ended on 12.26.18.
- The gain from that level was more than 1000 DOW points!
- It started 30 minutes after the video was published.
- Our subscribers had the trigger in advance.
- Here is the HHere is the Video
- 2. The 800 SPX points in Aug – Sept 2019.
After looking at the video for the best trading call in history above, the process of identifying the T-values that are used in Fibonacci Calculations become clearer, but complacency has been high, and more details are needed for some people ti understand. Below we show the video for the next sequential major Fibonacci Series. The video evidence for the 800 SPX points realized in a 1.5-month timespan during Aug-Sep 2019 can be used to further describe how to identify T values with more detail.
In addition to validating the 800 SPX points during that bad market environment, this video also helps describe how to use Fibonacci. Review the 800-Point Video
- 3. What about this Pandemic?
First, the all time high in the SPX was 3393, so we use that to identify T1, 2, 3 support values. These support levels have been identified in the chart below. They are, 3263, 3182, and 2843 respectively.
Basically, the Market has fallen to T-3 support.
To validate the cycle’s efficiency, the T1 and T2 values were highly actionable during this Pandemic and they acted as converted resistance after breaking too, which substantiates them.
Review 3264 and 3182 in this chart, and then the discussion of 2843 below.
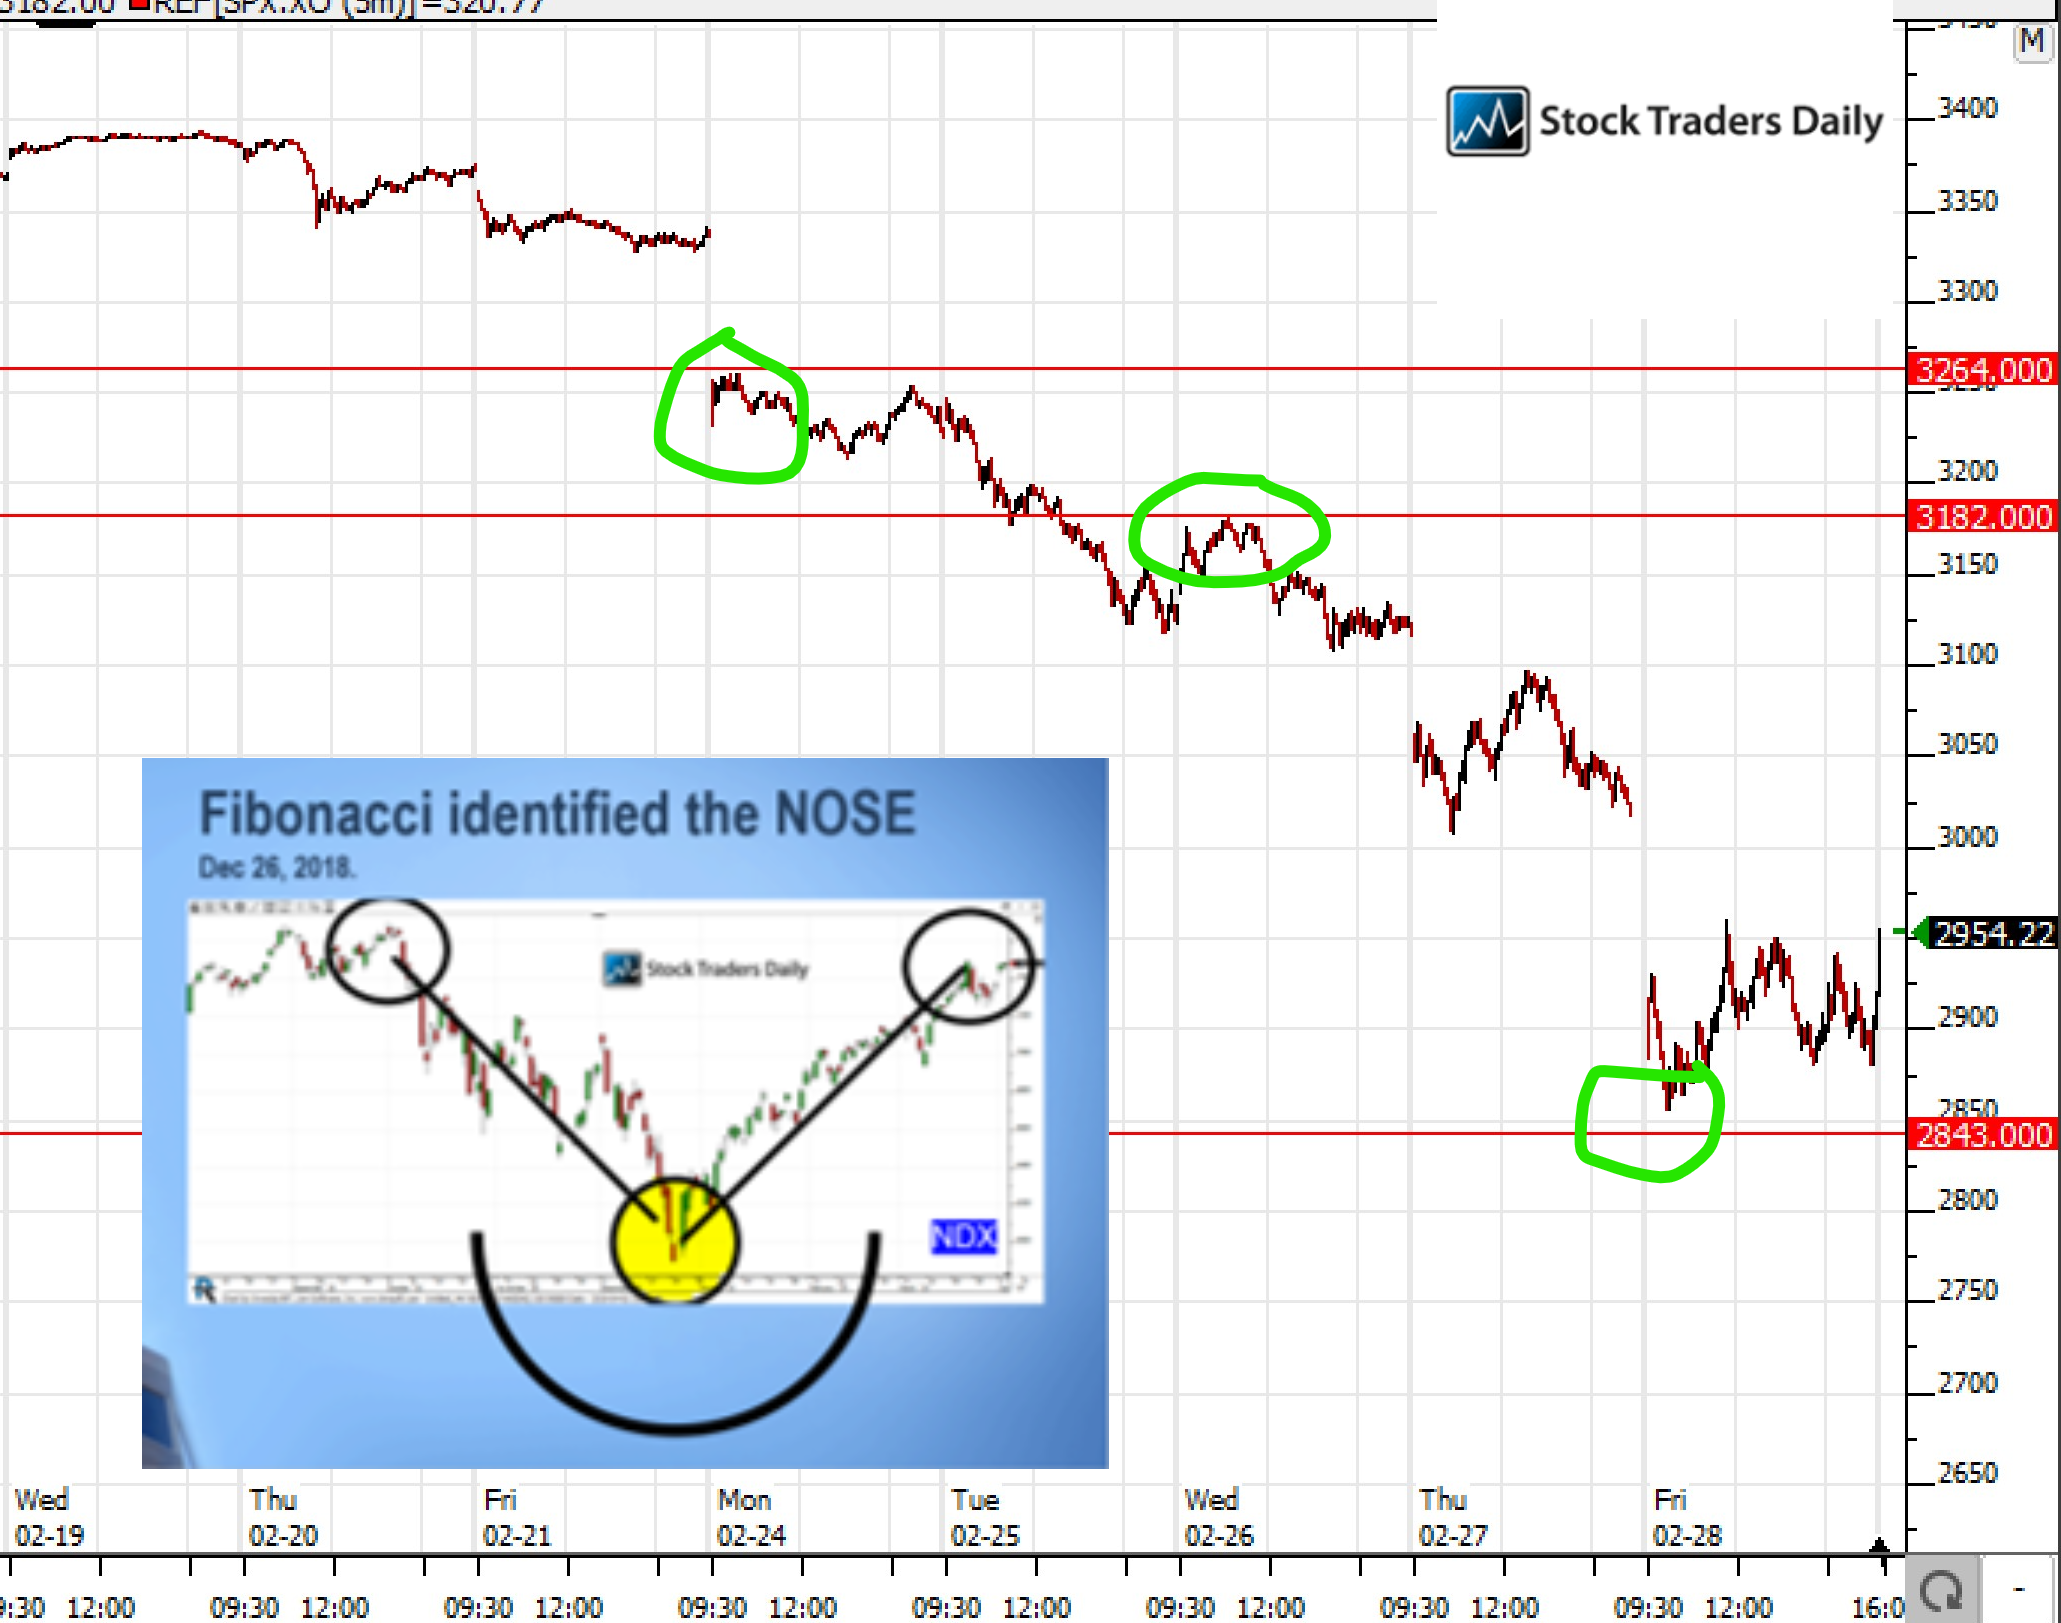
2843 is T3 support. During the December 2018 cycle, the ultimate turning point was also T3 support, so if the market turns higher from here it would be in line with that natural downside threshold. T-3 represents a far more emotional decline too, so these pandemic declines are more in line with the Dec. 2018 declines than the mid-2019 declines from that perspective. It has snap back potential too.
The T-3 value for this Pandemic Fibonacci cycle is 2843, and the Market came close to that level on Friday, but was that proximity to T3 support close enough? Answer = Yes.
T-3 can be tested again, of course, it can break too, but the market has turned higher and T3 may not be tested again. The proximity of the test was sufficient given the magnitude of the decline and given that the recent Fibonacci up-cycle stalled at 3393, which was just short of Fibonacci T2 resistance too.
A new Fibonacci Sequence began on February 6, and it was initially an up-channel, but that changed soon thereafter. Here is the Fibonacci Sequence announcement from February 6, 2020.
Target Resistance from support?
The T1, 2, 3 resistance values circled below will come into play if the market holds support. Because the market fell to T3, the T1 level of resistance is not as strong as T2 and T3, but the T1 level is still at about where the Market closed on Friday. Review the Calculator and Graph below.

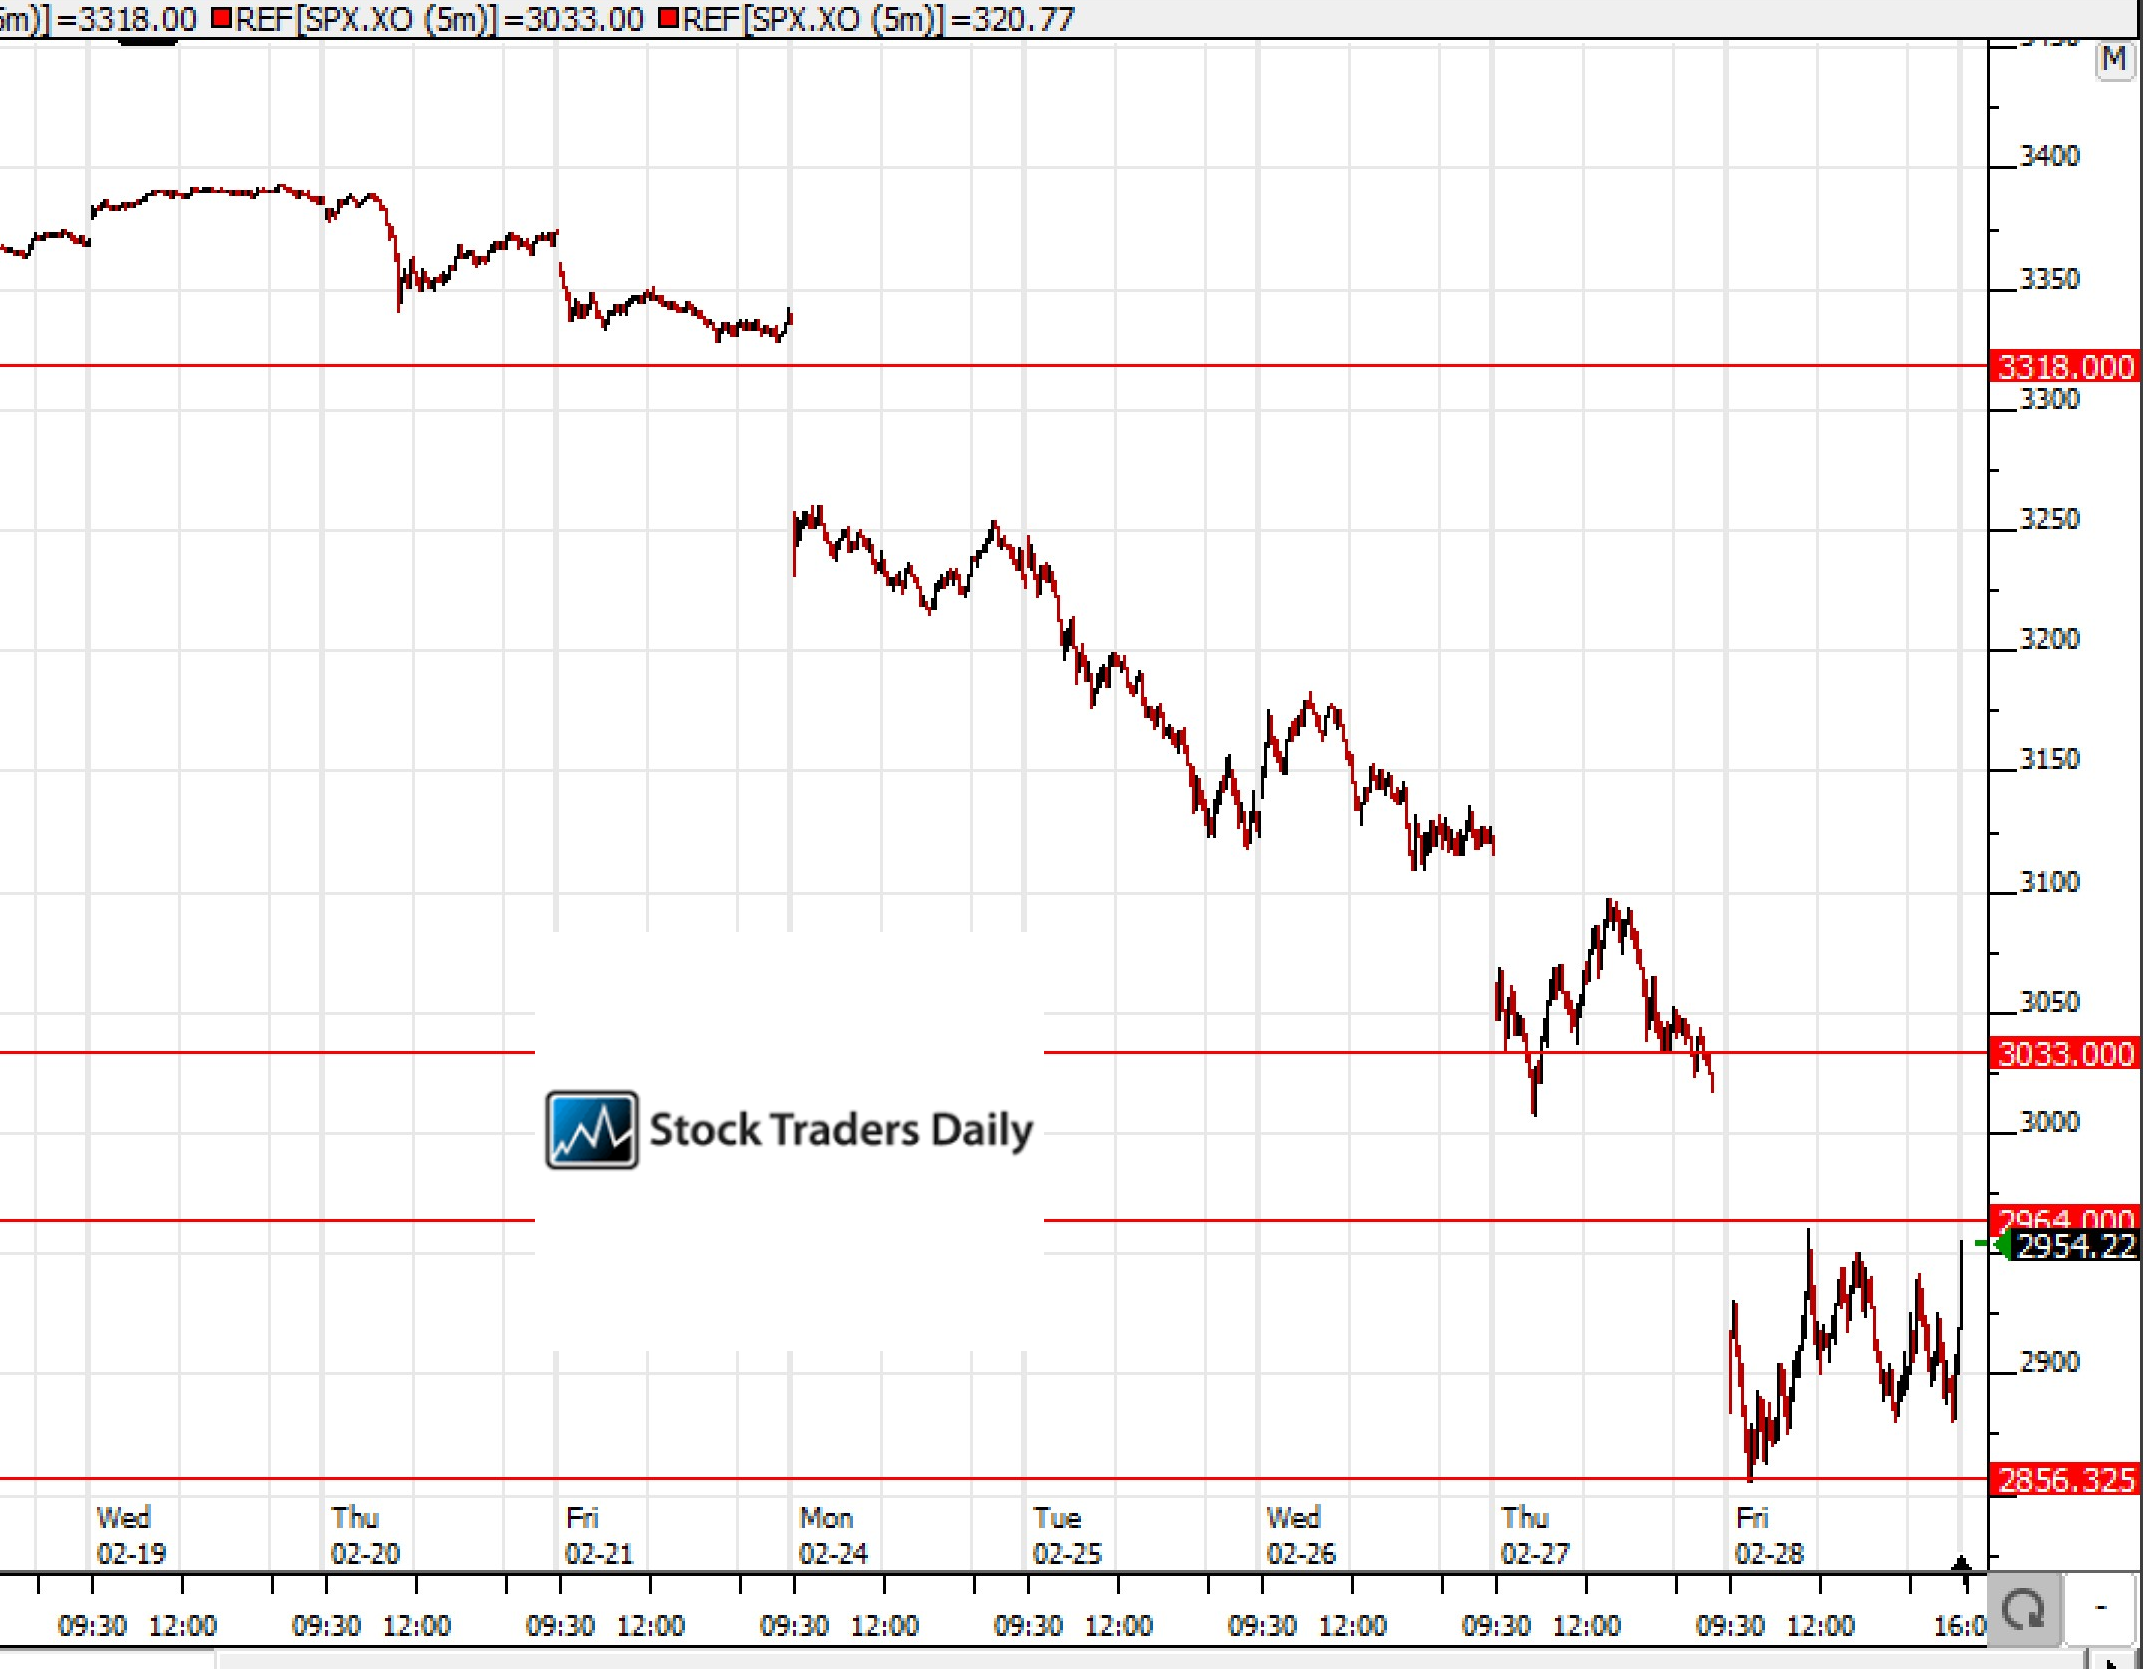
Given this assessment, Fibonacci is telling us to expect 3033 if the SPX breaks above 2964, and 2964 is very close to where the market closed Friday. Notice that these Fibonacci lines now also show up as resistance and converted resistance in the technicals too, further substantiating them.
Our Fibonacci Calculator is telling us that if 2843 holds and the Market breaks above 2964, 3033 should be the first target, followed by 3318.
These cycles are dynamic, and if 2843 breaks the T4 support value would actually come into play, so please review the Fibonacci Calculator and stay prepared, but the Fibonacci signals are similar to Dec 2018 declines so far, and there was a V-shaped recovery after that. We cannot be blind to market risk, and Fibonacci is telling us that the Market is not going to make new all time highs, but it does open the door for a material bounce back.
NASDAQ:
Technical Analysis for the NASDAQ 100 Index (INDEXNASDAQ: NDX), Ultra QQQ (NYSEARCA: QLD), and UltraShort QQQ (NYSEARCA: QID)
S&P 500:
Technical Analysis for the S&P 500 (INDEXSP: .INX), Ultra S&P500 (NYSEARCA: SSO), and ULTRASHORTS&P500 (NYSEARCA: SDS)
Dow Jones Industrial Average:
Technical Analysis for the Dow Jones Industrial Average (INDEXDJX: .DJI), ULTRA DOW (NYSEARCA: DDM), and ULTRASHORT DOW (NYSEARCA: DXD)
⚠Triggers may have already come
Support and Resistance Plot Chart for
Blue = Current Price
Red= Resistance
Green = Support
Real Time Updates for Repeat Institutional Readers:
Factset: Request User/Pass
Bloomberg, Reuters, Refinitiv, Zacks, or IB users: Access Here.
Our Market Crash Leading Indicator is Evitar Corte.
Evitar Corte warned of market crash risk four times since 2000.
It identified the Internet Debacle before it happened.
It identified the Credit Crisis before it happened.
It identified the Corona Crash too.
See what Evitar Corte is Saying Now.
Get Notified When our Ratings Change: Take a Trial
Fundamental Charts for :