Trump: Tell the FOMC to end QT
Today's CPI backs the FOMC into a corner. Liquidity is an issue.
January CPI 0.5% vs. 0.3% consensus; prior 0.4%.
Our most recent Economic Comment came after the Jobs data, whose headline was weak. We asked if that was a sign of broader economic weakness. We still don't know...
However, the other concern we expressed is being satisfied, and then some.
Inflation is a major concern now, again.
- Today's Hot CPI data, coupled with Tariff-inflation concerns, suggests no rate cut next time.
- Incoming Economic data would need to be pretty weak for a rate cut next time.
- This assumes that Tariff-uncertainty looms.
Furthermore, we believe that Tariff-uncertainty can result in economic apprehension. Some decision makers may take a wait and see approach, some may be going at this guns-blazing too, but the majority of Corporate America wants to be able to make calculated decisions; they cannot because they do not know how the chips will fall. This can result in slower activity and weaker economic data.
Therefore, we believe that Tariff-uncertainty can result in Economic Weakness, and it probably will.
The concern is, how long will economic weakness manifest?
- We already know we are in a Period of Low Liquidity.
- Low levels of Liquidity, are caused largely by the FOMC right now.
- Our Global Liquidity Report (link below) identifies Natural NEW demand for assets
Call to action: The FOMC can improve liquidity by putting an end to the balance sheet run-offs.
Specifically, the NATURAL inflows of NEW Money, as defined by “The Investment Rate,” our Macro Model, will not longer be impeded by QT; The FOMC is like a vacuum to liquidity, and that is happening while the Natural levels of demand are about to transition from a trough.
(Review our Special Reports for Details).
Longer Term Trading Plans for SPY
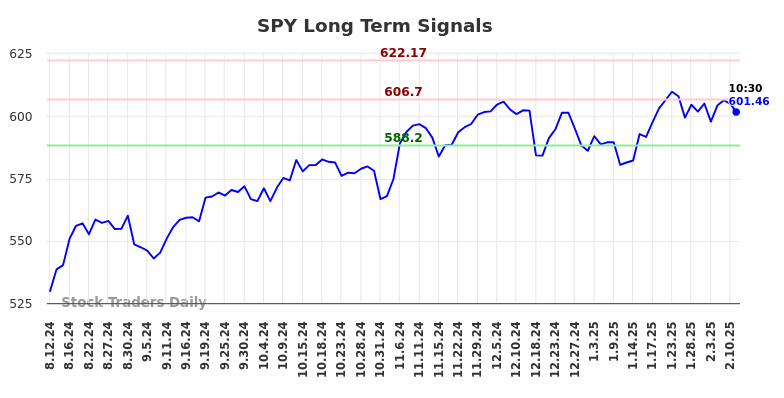
- Buy SPY near 588.2 target 606.7 stop loss @ 586.5
- Short SPY slightly under 606.7, target 588.2, stop loss @ 608.45
Swing Trading Plans for SPY
- Buy SPY slightly over 606.7, target 607.58, Stop Loss @ 604.95
- Short SPY slightly near 606.7, target 600.57, Stop Loss @ 608.45.
Day Trading Plans for SPY
- Buy SPY slightly over 602.95, target 606.42, Stop Loss @ 601.54
- Short SPY slightly near 602.95, target 600.57, Stop Loss @ 604.36.
SPY Ratings for February 12:
| Term → | Near | Mid | Long |
|---|---|---|---|
| Rating | Neutral | Neutral | Strong |
| P1 | 0 | 0 | 588.2 |
| P2 | 602.95 | 600.57 | 606.7 |
| P3 | 606.42 | 607.58 | 622.17 |
Support and Resistance Plot Chart for SPY

Blue = Current Price
Red= Resistance
Green = Support
Real Time Updates for Repeat Institutional Readers:
Factset: Request User/Pass
Bloomberg, Reuters, Refinitiv, Zacks, or IB users: Access Here.
Our Market Crash Leading Indicator is Evitar Corte.
Evitar Corte warned of market crash risk four times since 2000.
It identified the Internet Debacle before it happened.
It identified the Credit Crisis before it happened.
It identified the Corona Crash too.
See what Evitar Corte is Saying Now.
Get Notified When our Ratings Change: Take a Trial
