Valuation analysis for Xilinx, Inc. (NASDAQ:XLNX)
This article attempts to identify the fair value of the Xilinx, Inc. (NASDAQ:XLNX) using an earnings driven approach that compares earnings growth to PE multiples to define fair value. Our analysis of earnings excludes onetime events and includes complete earnings cycles to avoid seasonal anomalies.
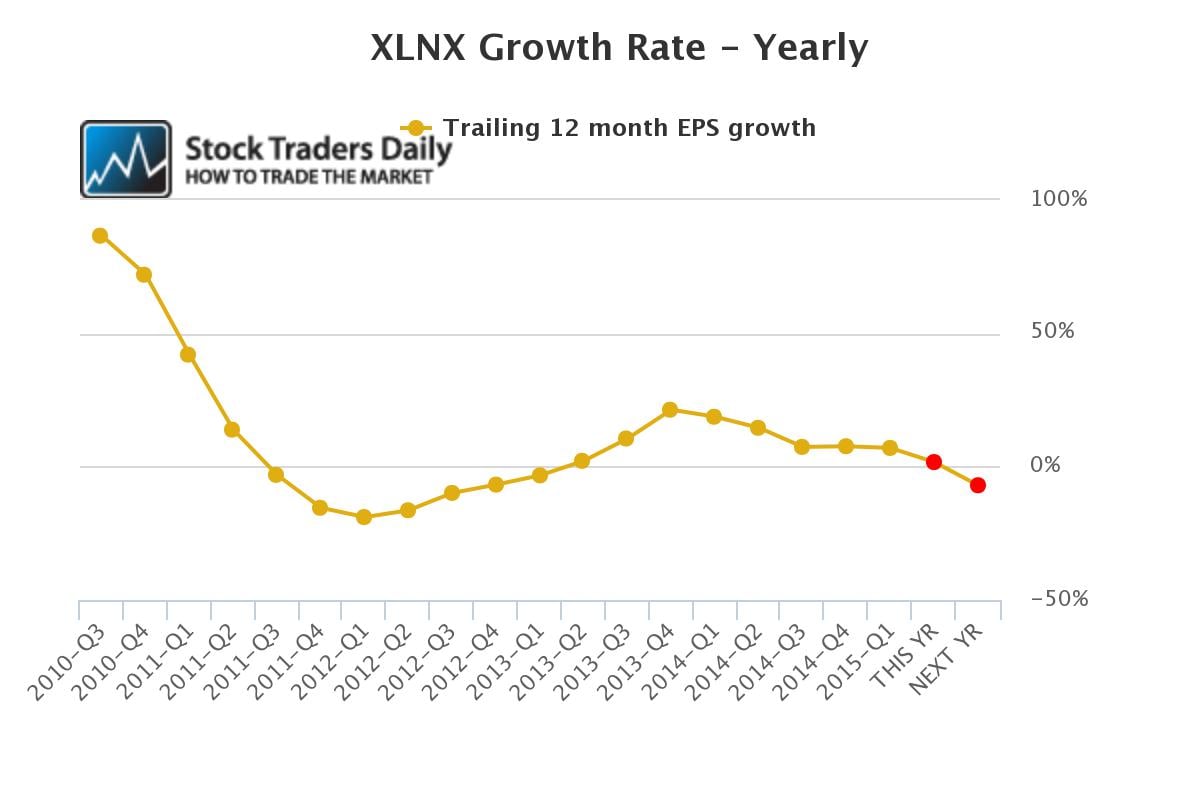
Our evaluation of Xilinx shows us that earnings are expected to contract in the year ahead and that poses serious risks. The first red dot in our EPS growth chart shows us that Xilinx is expected to grow at 1.73% this year, calendar 2015, but in calendar 2016 the EPS growth rate for Xilinx is expected to fall by 6.97%, by the end of calendar 2016. That is represented by the second red dot.

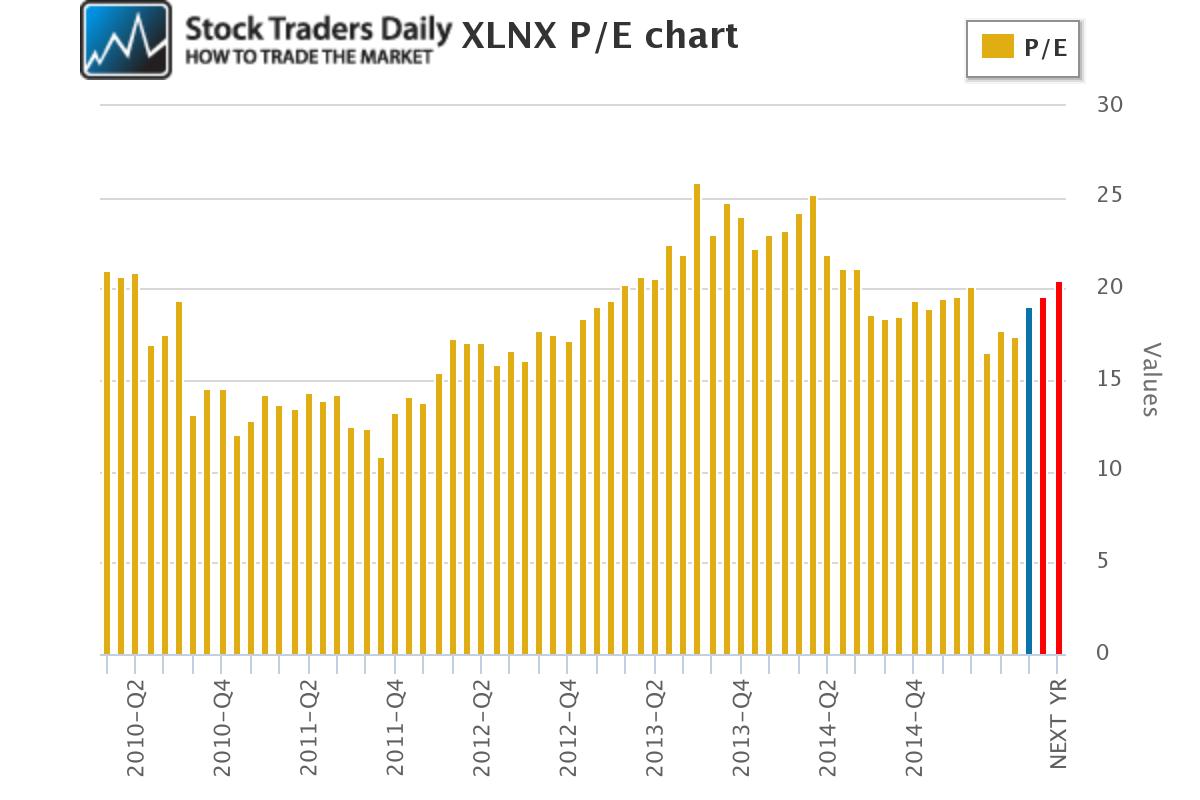
That brings our attention to the PE multiple, and the PE multiple is expected to increase from near 19, where it is today and represented by the blue bar in our chart, to over 20.4 at the end of calendar 2016 if analysts are right about their estimates and price remains the same.

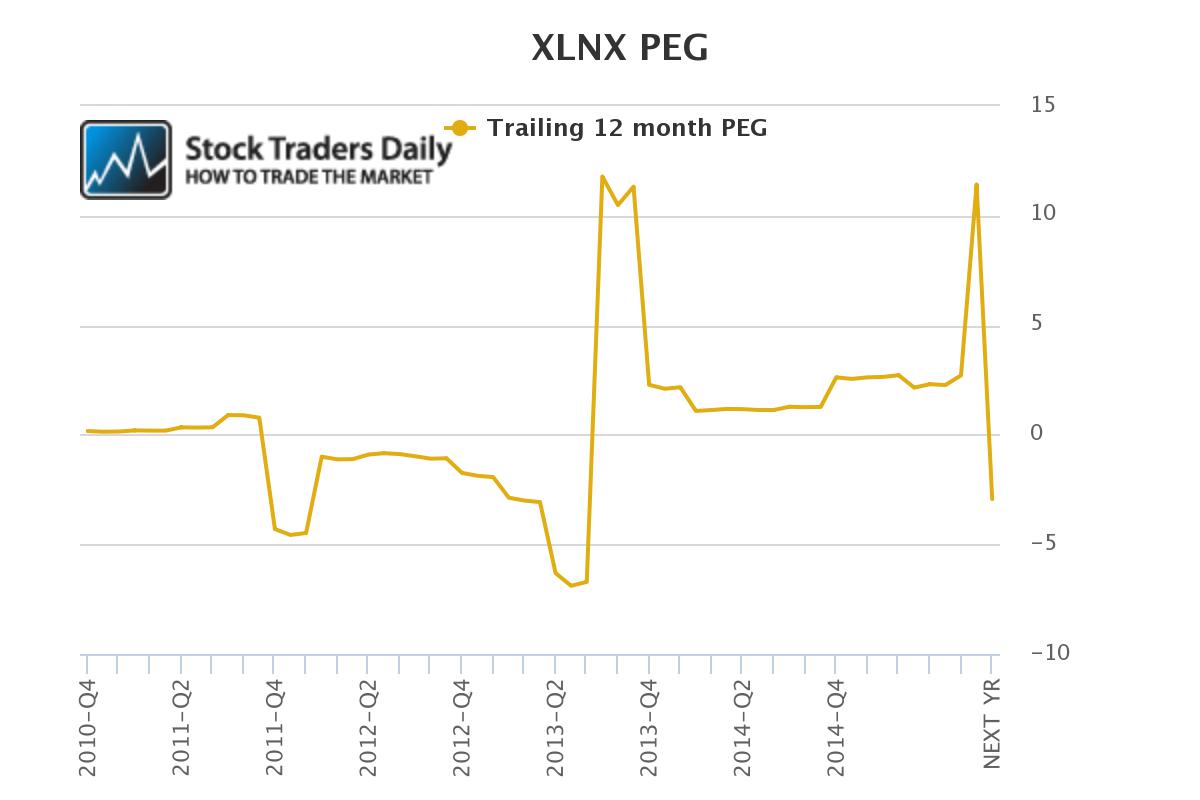
With both the earnings growth rate and the PE multiple in-hand, we can evaluate fair value for Xilinx more accurately using a peg ratio approach. Our analysis suggests that fair value exists when a peg ratio is between 0 and 1.5. The current peg ratio for Xilinx is 2.71, above that range, and if analysts are right about their estimates for calendar 2015 and price remains the same the peg ratio will skyrocket to 11.42 at the end of 2015, the first red dot, and then collapse to -2.93, the second red dot.

We don't consider Xilinx to be a value play at all, and the deterioration in earnings is risky.
Technical take:
According to our technical observation Xilinx is trading at a level of longer-term resistance and if that resistance level remains intact we expect the stock to decline measurably, back to longer term support levels again.
Summary:
Not only has XLNX tested a level of longer-term resistance, which should be respected, but the stock has no earnings based value, peg ratios are stretched and they will soon become quite erratic, and the lack of earnings growth coupled with the test of longer-term resistance in the stock offers sell signals and short signals. We would not be buying Xilinx, but instead consider selling and shorting the stock.
Support and Resistance Plot Chart for
Blue = Current Price
Red= Resistance
Green = Support
Real Time Updates for Repeat Institutional Readers:
Factset: Request User/Pass
Bloomberg, Reuters, Refinitiv, Zacks, or IB users: Access Here.
Our Market Crash Leading Indicator is Evitar Corte.
Evitar Corte warned of market crash risk four times since 2000.
It identified the Internet Debacle before it happened.
It identified the Credit Crisis before it happened.
It identified the Corona Crash too.
See what Evitar Corte is Saying Now.
Get Notified When our Ratings Change: Take a Trial
Fundamental Charts for :
