
Stock Analysis
Discipline and Rules-Based Execution in CSD Response
Key findings for Invesco S&p Spin-off Etf (NYSE: CSD)
- Near-Term Strong Sentiment Could Influence Mid-Term Neutrality Toward Long-Term Positive Bias
- No clear price positioning signal identified.
- No resistance levels remain above current price — compelling upside potential.
- Signals: 120.31 · 127.32 · 134.08 · 138.64 (bold = current price)
- Positive Sentiment is prevailing thus far — See current SIGNALS for positioning and risk parameters.
Institutional Trading Strategies
Our AI models have generated three distinct trading strategies tailored to different risk profiles and holding periods. Each strategy incorporates sophisticated risk management parameters designed to optimize position sizing and minimize drawdown risk.
Position Trading Strategy
LONG
Entry Zone
$134.08
Target
$144.81
Stop Loss
$133.69
Momentum Breakout Strategy
BREAKOUT
Trigger
$139.04
Target
$139.39
Stop Loss
$138.65
Risk Hedging Strategy
SHORT
Entry Zone
$139.39
Target
$132.42
Stop Loss
$139.81
Multi-Timeframe Signal Analysis
| Time Horizon | Signal Strength | Support Signal | Resistance Signal |
|---|---|---|---|
| Near-term (1-5 days) | Strong | $139.04 | $140.65 |
| Mid-term (5-20 days) | Neutral | $134.54 | $139.39 |
| Long-term (20+ days) | Strong | $127.32 | $134.08 |
AI Generated Signals for CSD
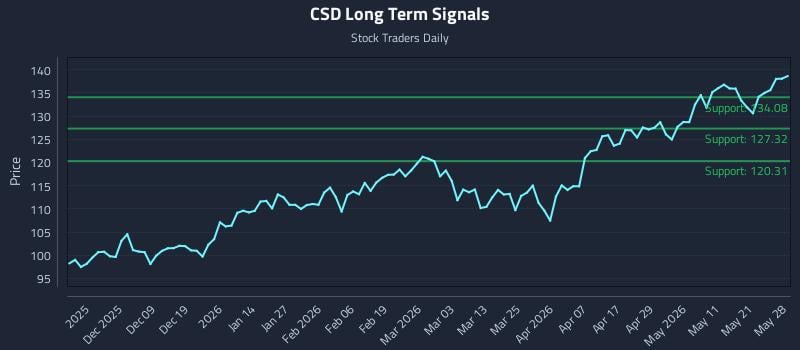
Blue = Current Price
Red = Resistance
Green = Support