How the price action of Duke Energy (DUK) is used to our Advantage
January 14, 2022, 20:15 pm ET, BY Robert S.- Contributor| Editor: Thomas H. Kee Jr. (Follow on LinkedIn)
Our job as #investors is to pay attention to the #stocks we own. Part of that involves looking at the #fundamentals, but half of the disclosure comes from looking at price action. The Duke Energy (NYSE: DUK) data table below can help you with price action, and we have more details too. Trading plans for DUK are shown here too; these plans are updated in real time for subscribers, where this report is static. If you want an update, or a report on a different stock, please get one here Unlimited Real Time Reports.
Longer Term Trading Plans for DUK
- Buy DUK slightly over 100.14 target 105.34 stop loss @ 99.85 Details
The technical summary data tells us to buy DUK near 100.14 with an upside target of 105.34. This data also tells us to set a stop loss @ 99.85 to protect against excessive loss in case the stock begins to move against the trade. 100.14 is the first level of support below 104.04 , and by rule, any test of support is a buy signal. In this case, support 100.14 would be being tested, so a buy signal would exist.
- Short DUK under 105.34, target 100.14, stop loss @ 105.64 Details
The technical summary data is suggesting a short of DUK as it gets near 105.34 with a downside target of 100.14. We should have a stop loss in place at 105.64though. 105.34 is the first level of resistance above 104.04, and by rule, any test of resistance is a short signal. In this case, if resistance 105.34 is being tested, so a short signal would exist.
Swing Trading Plans for DUK
- Buy DUK slightly over 104.45, target 105.34, Stop Loss @ 104.15 Details
If 104.45 begins to break higher, the technical summary data tells us to buy DUK just slightly over 104.45, with an upside target of 105.34. The data also tells us to set a stop loss @ 104.15 in case the stock turns against the trade. 104.45 is the first level of resistance above 104.04, and by rule, any break above resistance is a buy signal. In this case, 104.45, initial resistance, would be breaking higher, so a buy signal would exist. Because this plan is based on a break of resistance, it is referred to as a Long Resistance Plan.
- Short DUK near 104.45, target 102.99, Stop Loss @ 104.75. Details
The technical summary data is suggesting a short of DUK if it tests 104.45 with a downside target of 102.99. We should have a stop loss in place at 104.75 though in case the stock begins to move against the trade. By rule, any test of resistance is a short signal. In this case, if resistance, 104.45, is being tested a short signal would exist. Because this plan is a short plan based on a test of resistance it is referred to as a Short Resistance Plan.
Day Trading Plans for DUK
- Buy DUK slightly over 104.19, target 104.45, Stop Loss @ 103.95 Details
If 104.19 begins to break higher, the technical summary data tells us to buy DUK just slightly over 104.19, with an upside target of 104.45. The data also tells us to set a stop loss @ 103.95 in case the stock turns against the trade. 104.19 is the first level of resistance above 104.04, and by rule, any break above resistance is a buy signal. In this case, 104.19, initial resistance, would be breaking higher, so a buy signal would exist. Because this plan is based on a break of resistance, it is referred to as a Long Resistance Plan.
- Short DUK near 104.19, target 102.99, Stop Loss @ 104.43. Details
The technical summary data is suggesting a short of DUK if it tests 104.19 with a downside target of 102.99. We should have a stop loss in place at 104.43 though in case the stock begins to move against the trade. By rule, any test of resistance is a short signal. In this case, if resistance, 104.19, is being tested a short signal would exist. Because this plan is a short plan based on a test of resistance it is referred to as a Short Resistance Plan.
DUK Ratings for January 14:
| Term → | Near |
Mid |
Long |
|---|
| Rating |
Neutral |
Strong |
Strong |
| P1 |
0 |
0 |
100.14 |
| P2 |
102.76 |
102.99 |
105.34 |
| P3 |
104.19 |
104.45 |
110.61 |
⚠Triggers may have already come
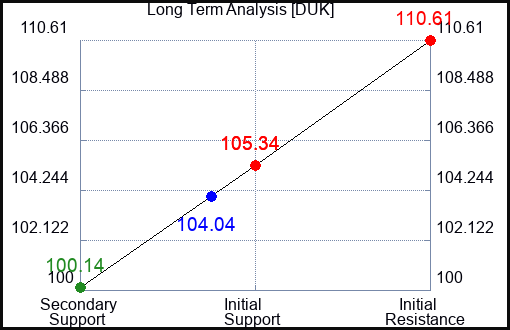
Support and Resistance Plot Chart for DUK
Blue = Current Price
Red= Resistance
Green = Support
Real Time Updates for Repeat Institutional Readers:
Factset: Request User/Pass
Bloomberg, Reuters, Refinitiv, Zacks, or IB users: Access Here.
Our Market Crash Leading Indicator is Evitar Corte.
Evitar Corte warned of market crash risk four times since 2000.
It identified the Internet Debacle before it happened.
It identified the Credit Crisis before it happened.
It identified the Corona Crash too.
See what Evitar Corte is Saying Now.
Get Notified When our Ratings Change: Take a Trial
Fundamental Charts for DUK:
 pool ads