Managing Risk in L Brands Inc LB by Using Price Action
Technical Summary
| Term → | Near | Mid | Long |
|---|---|---|---|
| Rating | Neutral | Neutral | Strong |
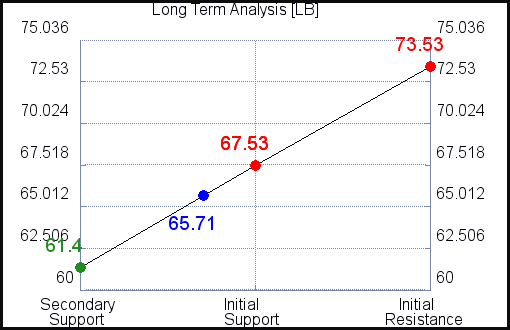
| P1 | 0 | 0 | 61.40 |
| P2 | 66.03 | 66.84 | 67.53 |
| P3 | 68.16 | 70.70 | 73.53 |
Support and Resistance Plot Chart for LB
Longer Term Trading Plans for LB
LB - (Long) Support Plan
Buy over 61.40 target 67.53 stop loss @ 61.22
LB - (Short) Resistance Plan
Short under 67.53, target 61.40, stop loss @ 67.73

Blue = Current Price
Red = Resistance
Green = Support
Real Time Updates for Repeat Institutional Readers:
Factset: Request User/Pass
Bloomberg, Reuters, Refinitiv, Zacks, or IB users: Access Here.
Our Market Crash Leading Indicator is Evitar Corte.
Evitar Corte warned of market crash risk four times since 2000.
It identified the Internet Debacle before it happened.
It identified the Credit Crisis before it happened.
It identified the Corona Crash too.
See what Evitar Corte is Saying Now.
Get Notified When our Ratings Change: Take a Trial
Fundamental Charts for LB: