Changes to the Price of Cvs Health Corp CVS Influence Investor Perception
Often, the action in a #stock is based on #investor perceptions, but it can be a circular event. Not only is the #priceaction representative of perception, but it can influence perception too. In the case of Cvs Health Corp (NYSE: CVS) we can see this in the charts. The data for CVS in the summary table and trading plans below are intended to provide an example of how to extrapolate this. Our data was current at the time of publication, but it is not updated in real time here. If you want real time updates, or data on a different stock, please get one here Unlimited Real Time Reports.
Technical Summary
| Term → | Near | Mid | Long |
|---|---|---|---|
| Rating | Strong | Strong | Strong |
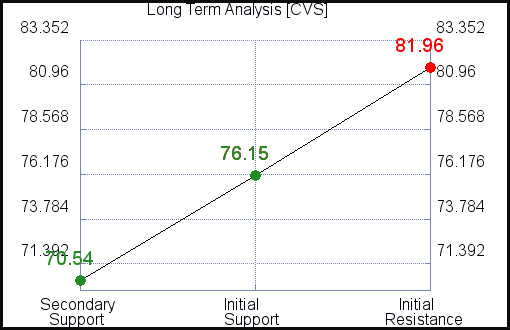
| P1 | 0 | 0 | 70.54 |
| P2 | 85.76 | 87.99 | 76.15 |
| P3 | 87.56 | 91.62 | 81.96 |
Support and Resistance Plot Chart for CVS
Longer Term Trading Plans for CVS
May 30, 2021, 11:15 pm ET
CVS - (Long) Support Plan
Buy over 81.96 target n/a stop loss @ 81.72.
CVS - (Short) Resistance Plan
NONE .

Blue = Current Price
Red= Resistance
Green = Support
Real Time Updates for Repeat Institutional Readers:
Factset: Request User/Pass
Bloomberg, Reuters, Refinitiv, Zacks, or IB users: Access Here.
Our Market Crash Leading Indicator is Evitar Corte.
Evitar Corte warned of market crash risk four times since 2000.
It identified the Internet Debacle before it happened.
It identified the Credit Crisis before it happened.
It identified the Corona Crash too.
See what Evitar Corte is Saying Now.
Get Notified When our Ratings Change: Take a Trial
