Stock Analysis
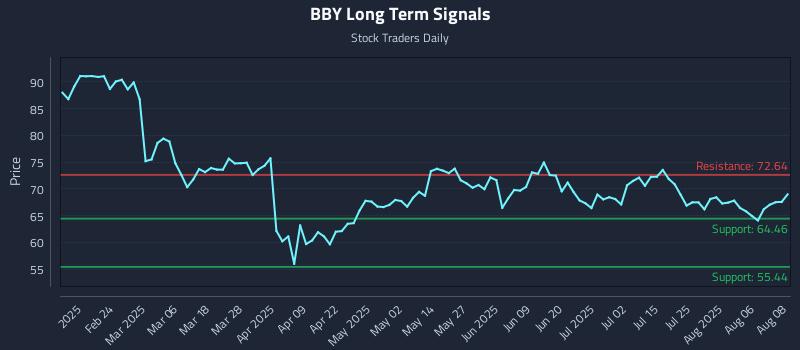
Precision Trading with Best Buy Co. Inc. (BBY) Risk Zones
Key Findings
- Strength has returned after a phase of broader weakness
- Mid-range consolidation at $69.03 with 6.6% downside cushion
- Exceptional 43.1:1 risk-reward setup targets 12.7% gain vs 0.3% risk
- Compressed near-term range between $67.98-$68.87 signals imminent volatility expansion
- Divergent timeframe signals require selective entry with defined risk parameters
Institutional Trading Strategies
Our AI models have generated three distinct trading strategies tailored to different risk profiles and holding periods. Each strategy incorporates sophisticated risk management parameters designed to optimize position sizing and minimize drawdown risk.
Position Trading Strategy
LONG
Entry Zone
$64.46
Target
$72.64
Stop Loss
$64.27
Momentum Breakout Strategy
BREAKOUT
Trigger
$72.64
Target
$74.09
Stop Loss
$72.44
Risk Hedging Strategy
SHORT
Entry Zone
$72.64
Target
$69.01
Stop Loss
$72.86
Multi-Timeframe Signal Analysis
| Time Horizon | Signal Strength | Support Signal | Resistance Signal |
|---|---|---|---|
| Near-term (1-5 days) | Strong | $67.98 | $68.87 |
| Mid-term (5-20 days) | Neutral | $65.35 | $68.23 |
| Long-term (20+ days) | Weak | $64.46 | $72.64 |
AI Generated Signals for BBY

Blue = Current Price
Red = Resistance
Green = Support
