
Key findings for Lindblad Expeditions Holdings Inc. (NASDAQ: LIND)
- Weak Near and Mid-Term Sentiment Could Challenge Long-Term Positive Outlook
- A mid-channel oscillation pattern is in play.
- Exceptional 56.4:1 risk-reward setup targets 16.0% gain vs 0.3% risk
- Signals: 24.64 · 25.69 · 28.59 · 32.66 (bold = current price)
- Weak Sentiment is prevailing thus far — See current SIGNALS for positioning and risk parameters.
Institutional Trading Strategies
Our AI models have generated three distinct trading strategies tailored to different risk profiles and holding periods. Each strategy incorporates sophisticated risk management parameters designed to optimize position sizing and minimize drawdown risk.
Trading Plans Summary
Side-by-Side Comparison| Trading Plan | Bias | Action / Trigger | Profit Target | Stop Loss | Execution Rule |
|---|---|---|---|---|---|
| Position Trading Strategy Multi-Week (Position) | LONG | $24.64 | $28.59 (+16.0%) | $24.57 (−0.28%) | Enter near the entry level; take profit at the target; stop loss if support fails. |
| Momentum Breakout Strategy 1–5 Days (Breakout) | BREAKOUT | $27.16 | $28.14 (+3.61%) | $27.08 (−0.29%) | Enter on a breakout above the trigger; take profit at the target; stop loss if the breakout fails. |
| Risk Hedging Strategy Tactical / Swing | SHORT | $28.14 | $26.73 (−5.01%) | $28.22 (+0.28%) | Enter short near the entry level; cover at the target; stop loss if resistance breaks. |
Multi-Timeframe Signal AnalysisWeak Bias
| Time Horizon | Signal Strength | Support Signal | Resistance Signal |
|---|---|---|---|
| Near-term (1-5 days) | Weak | $27.16 | $28.43 |
| Mid-term (5-20 days) | Weak | $28.14 | $30.03 |
| Long-term (20+ days) | Strong | $28.59 | $32.66 |
AI Generated Signals for LIND
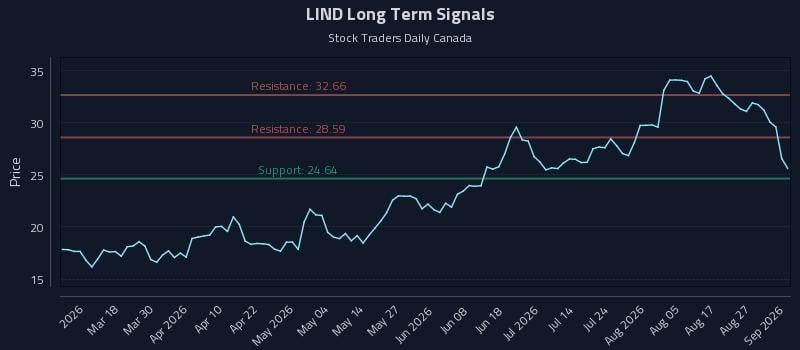
Blue = Current Price
Red = Resistance
Green = Support