
Stock Analysis
Technical Reactions to IRTC Trends in Macro Strategies
Key findings for Irhythm Technologies Inc. (NASDAQ: IRTC)
- Near-Term Weak Sentiment May Signal Resumption of Long-Term Weakness After Neutral Shift
- Resistance is being tested. If it holds, expect support next.
- Exceptional 67.6:1 risk-reward short setup targets 19.6% downside vs 0.3% risk
- Signals: 91.34 · 110.88 · 113.65 · 136.82 (bold = current price)
- Weak Sentiment is prevailing thus far — See current SIGNALS for positioning and risk parameters.
Institutional Trading Strategies
Our AI models have generated three distinct trading strategies tailored to different risk profiles and holding periods. Each strategy incorporates sophisticated risk management parameters designed to optimize position sizing and minimize drawdown risk.
Position Trading Strategy
LONG
Entry Zone
$91.34
Target
$113.65
Stop Loss
$91.08
Momentum Breakout Strategy
BREAKOUT
Trigger
$113.65
Target
$114.26
Stop Loss
$113.33
Risk Hedging Strategy
SHORT
Entry Zone
$113.65
Target
$107.97
Stop Loss
$113.99
Multi-Timeframe Signal Analysis
| Time Horizon | Signal Strength | Support Signal | Resistance Signal |
|---|---|---|---|
| Near-term (1-5 days) | Weak | $108.87 | $114.26 |
| Mid-term (5-20 days) | Neutral | $107.69 | $114.10 |
| Long-term (20+ days) | Weak | $113.65 | $136.82 |
AI Generated Signals for IRTC
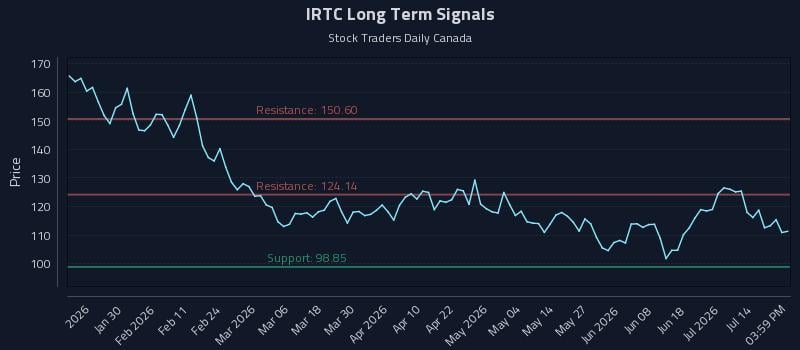
Blue = Current Price
Red = Resistance
Green = Support