 pool ads
Valuation analysis for International Business Machines Corp. (NYSE:IBM)
This is the fourteenth report that Stock Traders Daily has publicly issued for the thirty stocks that comprise the DJIA, there are sixteen public reports waiting to be published, and by the time these are published they will help investors identify fair value for the market as a whole. The data being used and a fair value market analysis has already been supplied to clients of Stock Traders Daily.
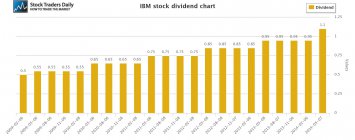
International Business Machines Corp. (NYSE:IBM) is a company that has been criticized by investors who would like to see the company grow faster than it is, but for investors who appreciate increasing dividends IBM has successfully increased its dividend and between 2008 and today the dividend has almost doubled. That is fantastic for investors who are interested in dividends, but IBM poses challenges for investors looking for growth.
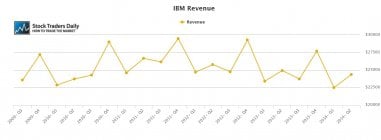
In fact, when looking at not only earnings but also revenue growth we can see that revenues have actually been steadily declining. It is tough to imagine earnings growth from operations in the face of declining revenues, but in fact that is exactly what has happened recently at IBM.
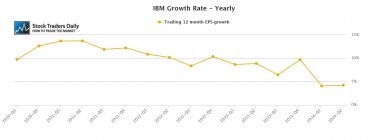
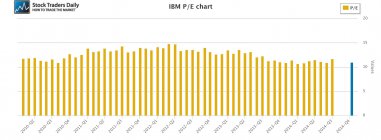
The problem is investors don't seem to be buying into that story. The stock has actually experienced multiple contractions in the face of increased EPS growth and the PE multiple for IBM declined from near 13x to near 11x while earnings increased at a decent rate. Again, though, the rationale seems to be the relationship between deteriorating revenue growth and earnings.
Technical take:
According to our real time trading report for IBM there are no reasons to buy or sell the stock at this time. On a technical basis IBM looks to be floundering. There is no better way to say this. Ideally we would like to see the stock moving from support towards resistance, or from resistance towards support, but IBM seems to be stuck right in the middle of its longer term trading channel and that tells us that the stock is floundering.
Summary:
On a fundamental basis IBM does not appear to be in a comfortable financial position. The relationship between revenue growth and earnings growth should be somewhat parallel, but instead revenues have been steadily declining while earnings growth has been realized. That is an unsustainable business model and although IBM is considered to be a bellwether it has uniquely experienced multiple contraction while almost every other stock in the Dow Jones industrial average has experienced multiple expansion. That suggests that large money has been selling IBM even as other money has flown into the Dow Jones industrial average in recent years. Given the floundering nature of the longer-term chart pattern for IBM we would further suggest that there are no immediate buy or sell signals, and consider IBM to be an avoid appropriately.
Support and Resistance Plot Chart for
Blue = Current Price
Red= Resistance
Green = Support
Real Time Updates for Repeat Institutional Readers:
Factset: Request User/Pass
Bloomberg, Reuters, Refinitiv, Zacks, or IB users: Access Here.
Our Market Crash Leading Indicator is Evitar Corte.
Evitar Corte warned of market crash risk four times since 2000.
It identified the Internet Debacle before it happened.
It identified the Credit Crisis before it happened.
It identified the Corona Crash too.
See what Evitar Corte is Saying Now.
Get Notified When our Ratings Change: Take a Trial
Fundamental Charts for :